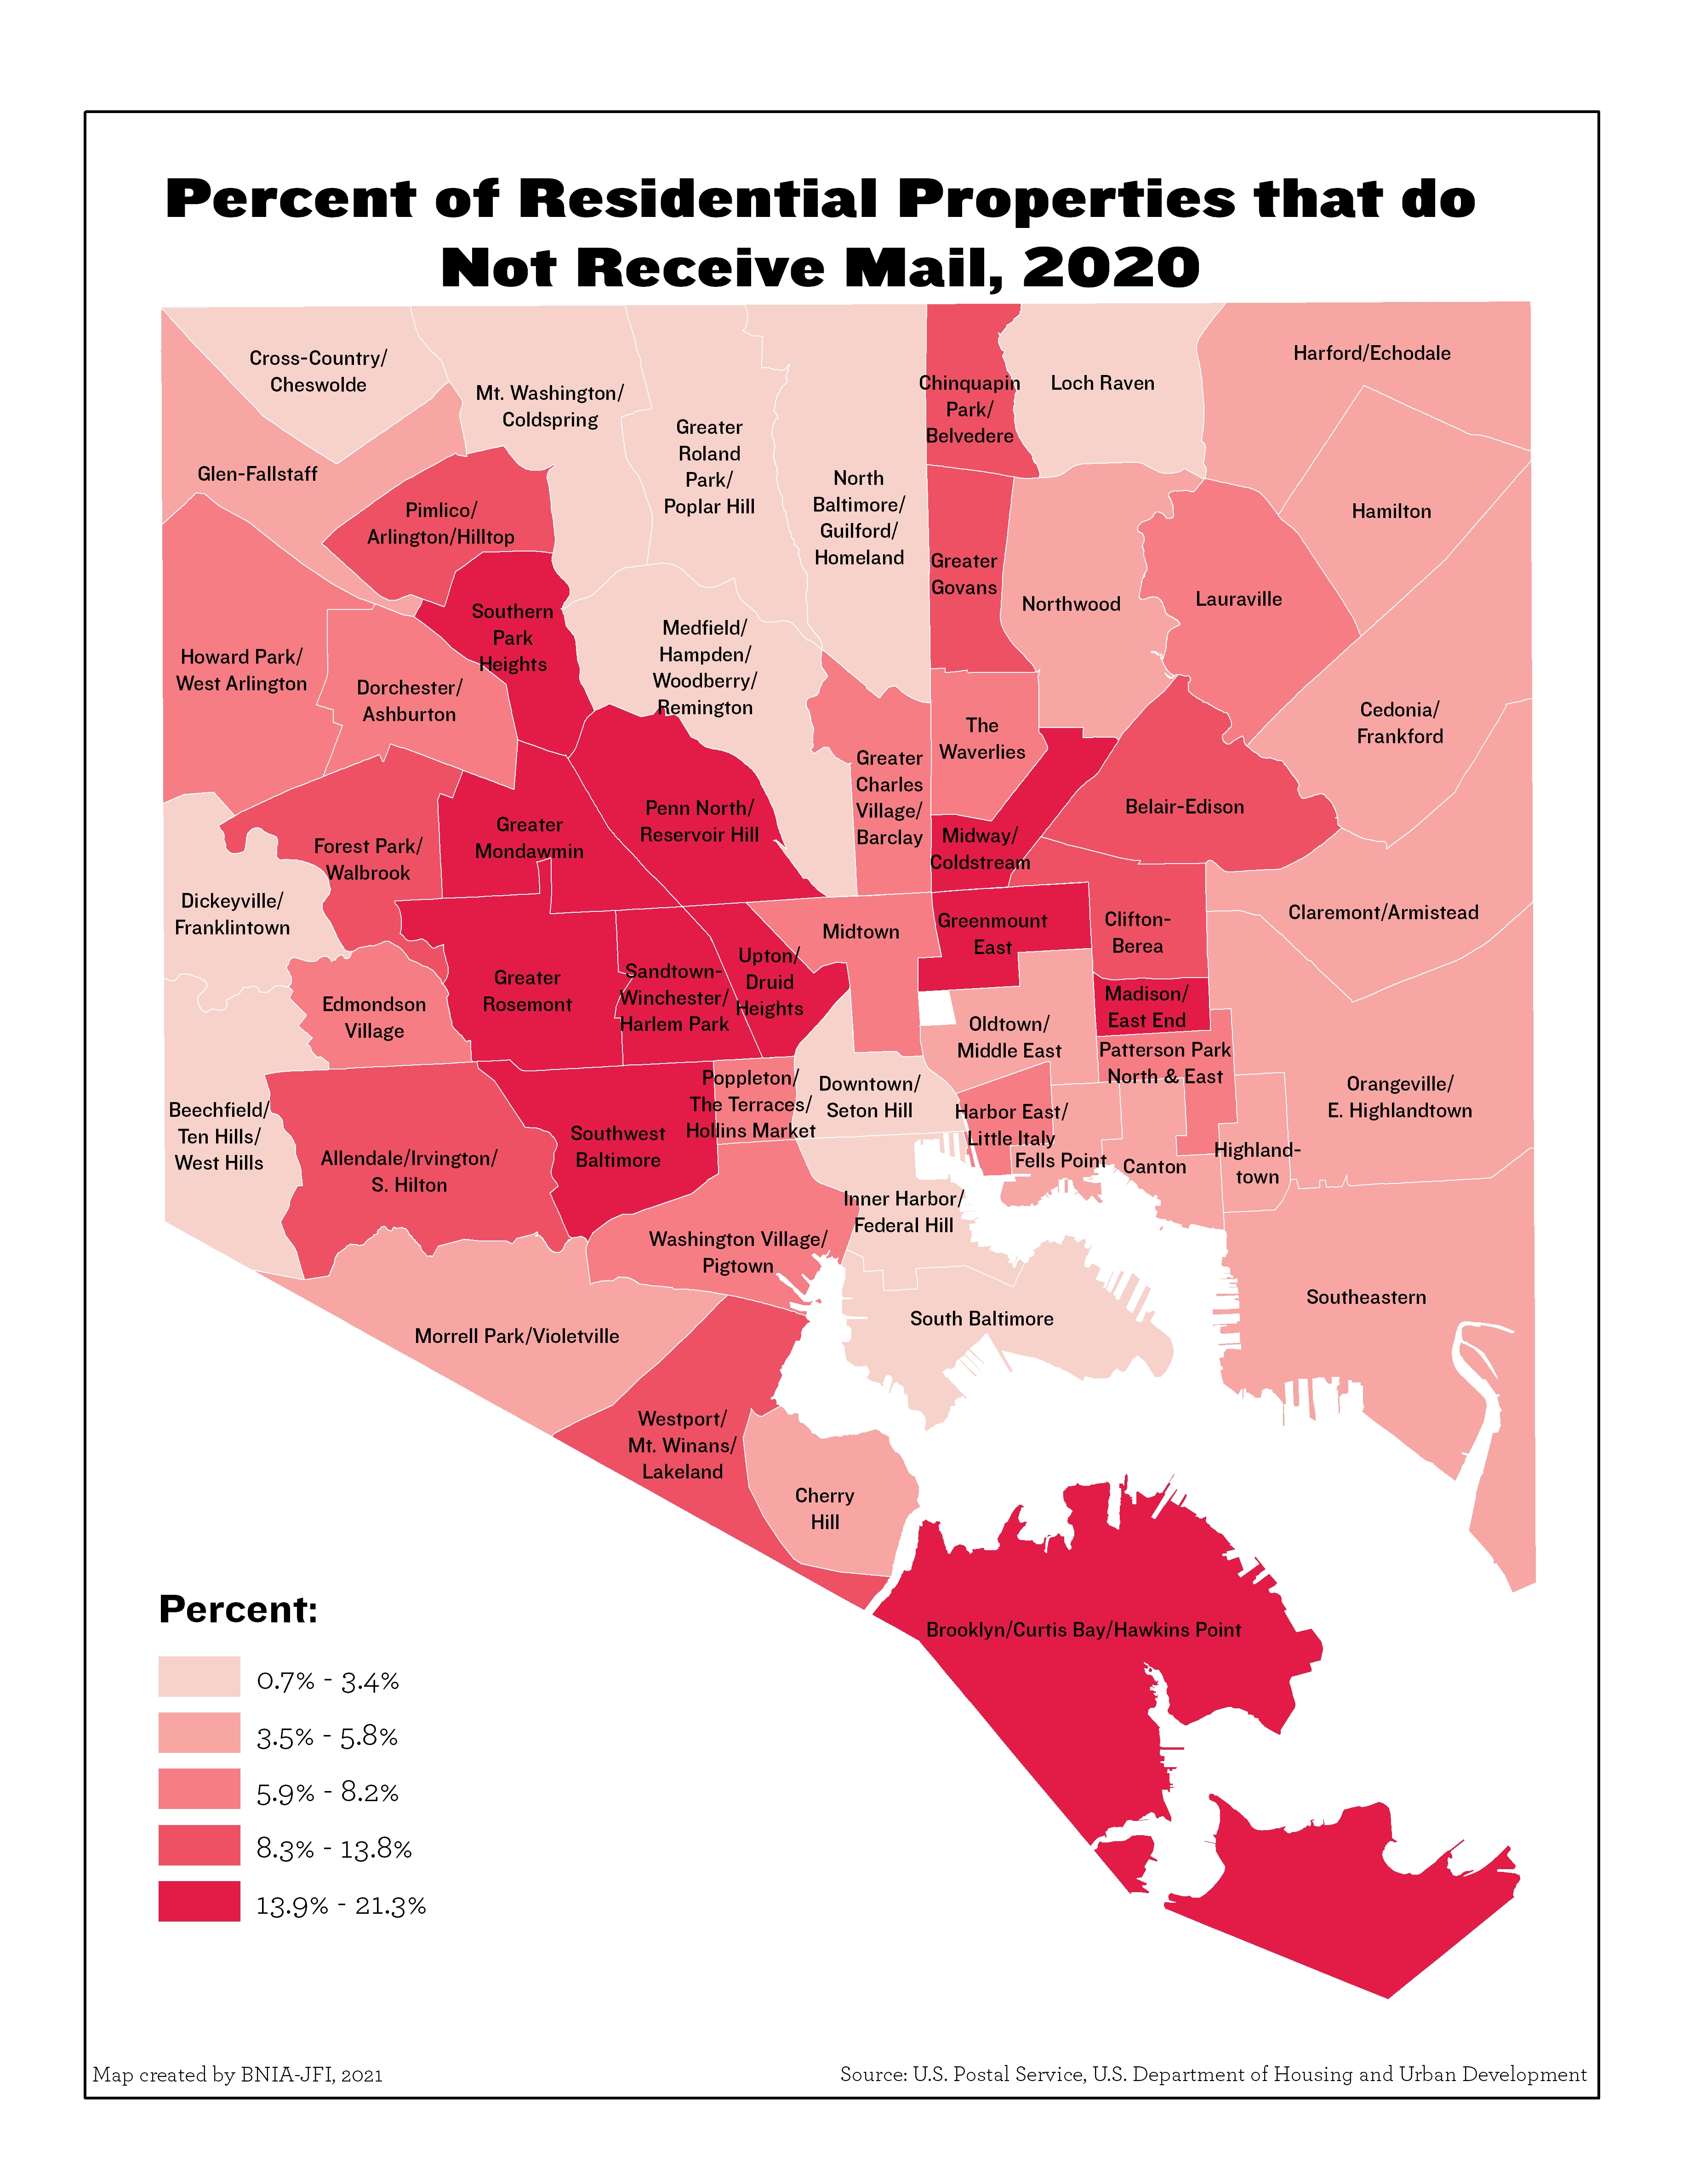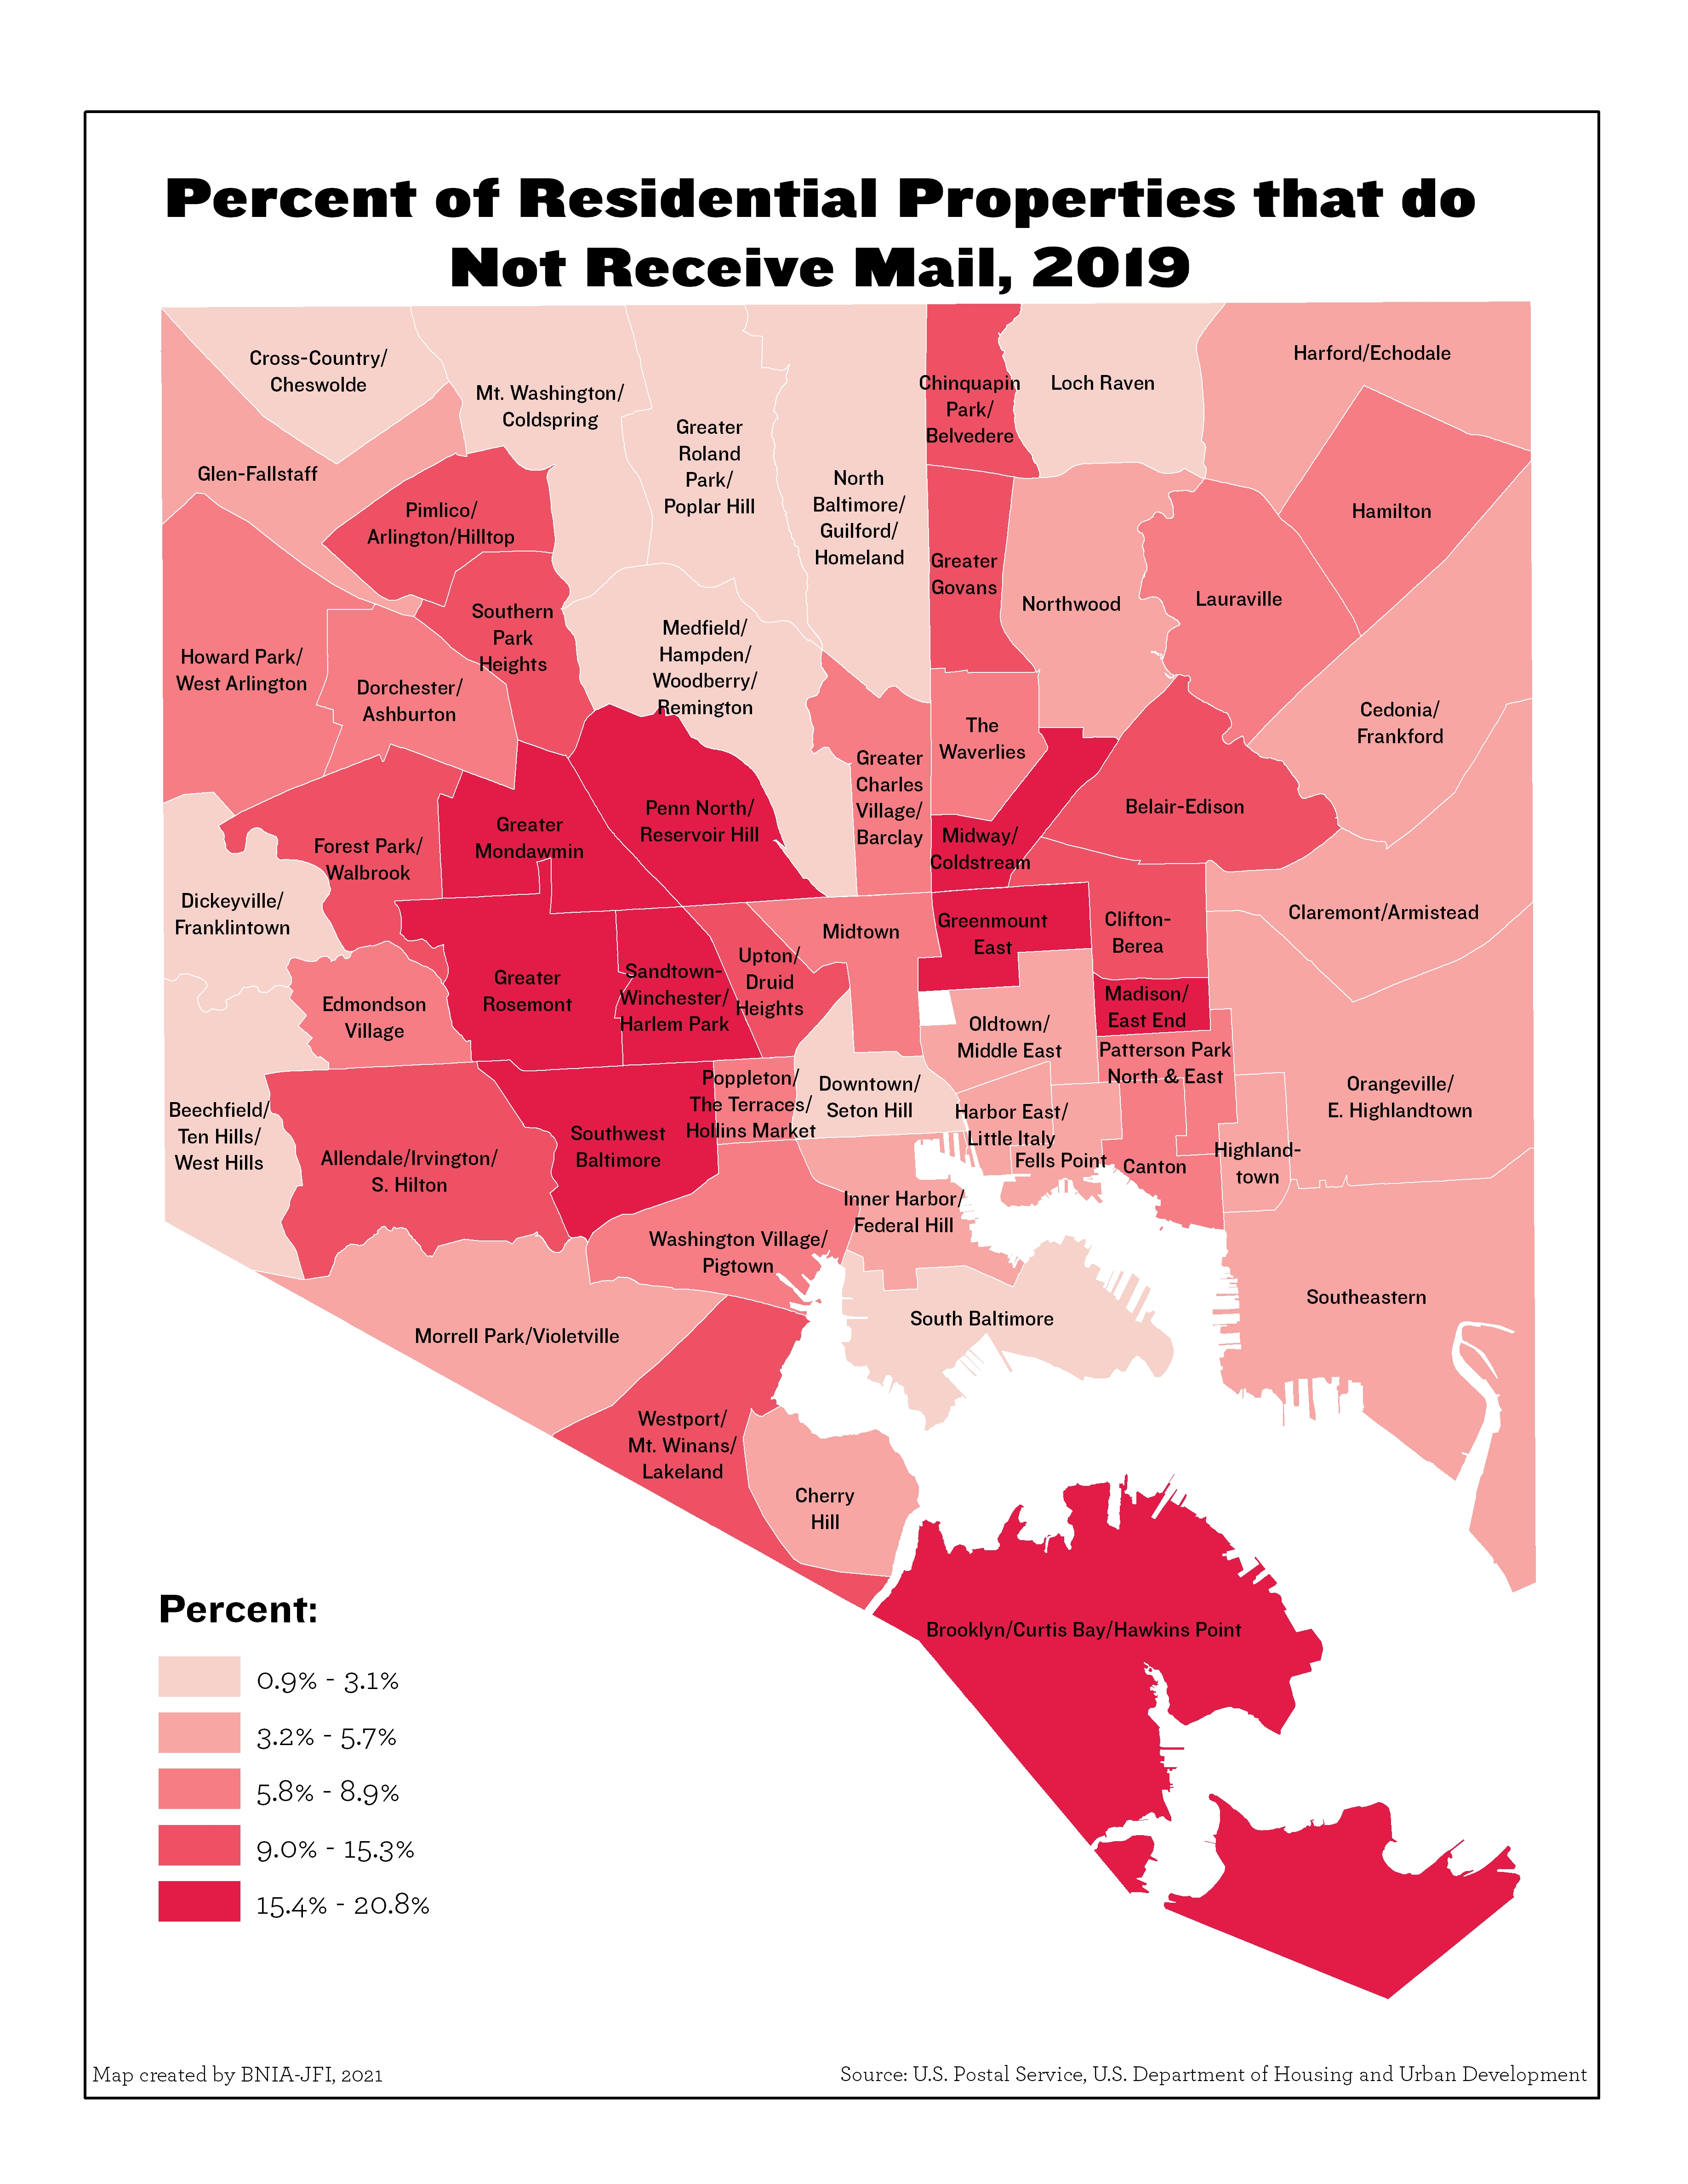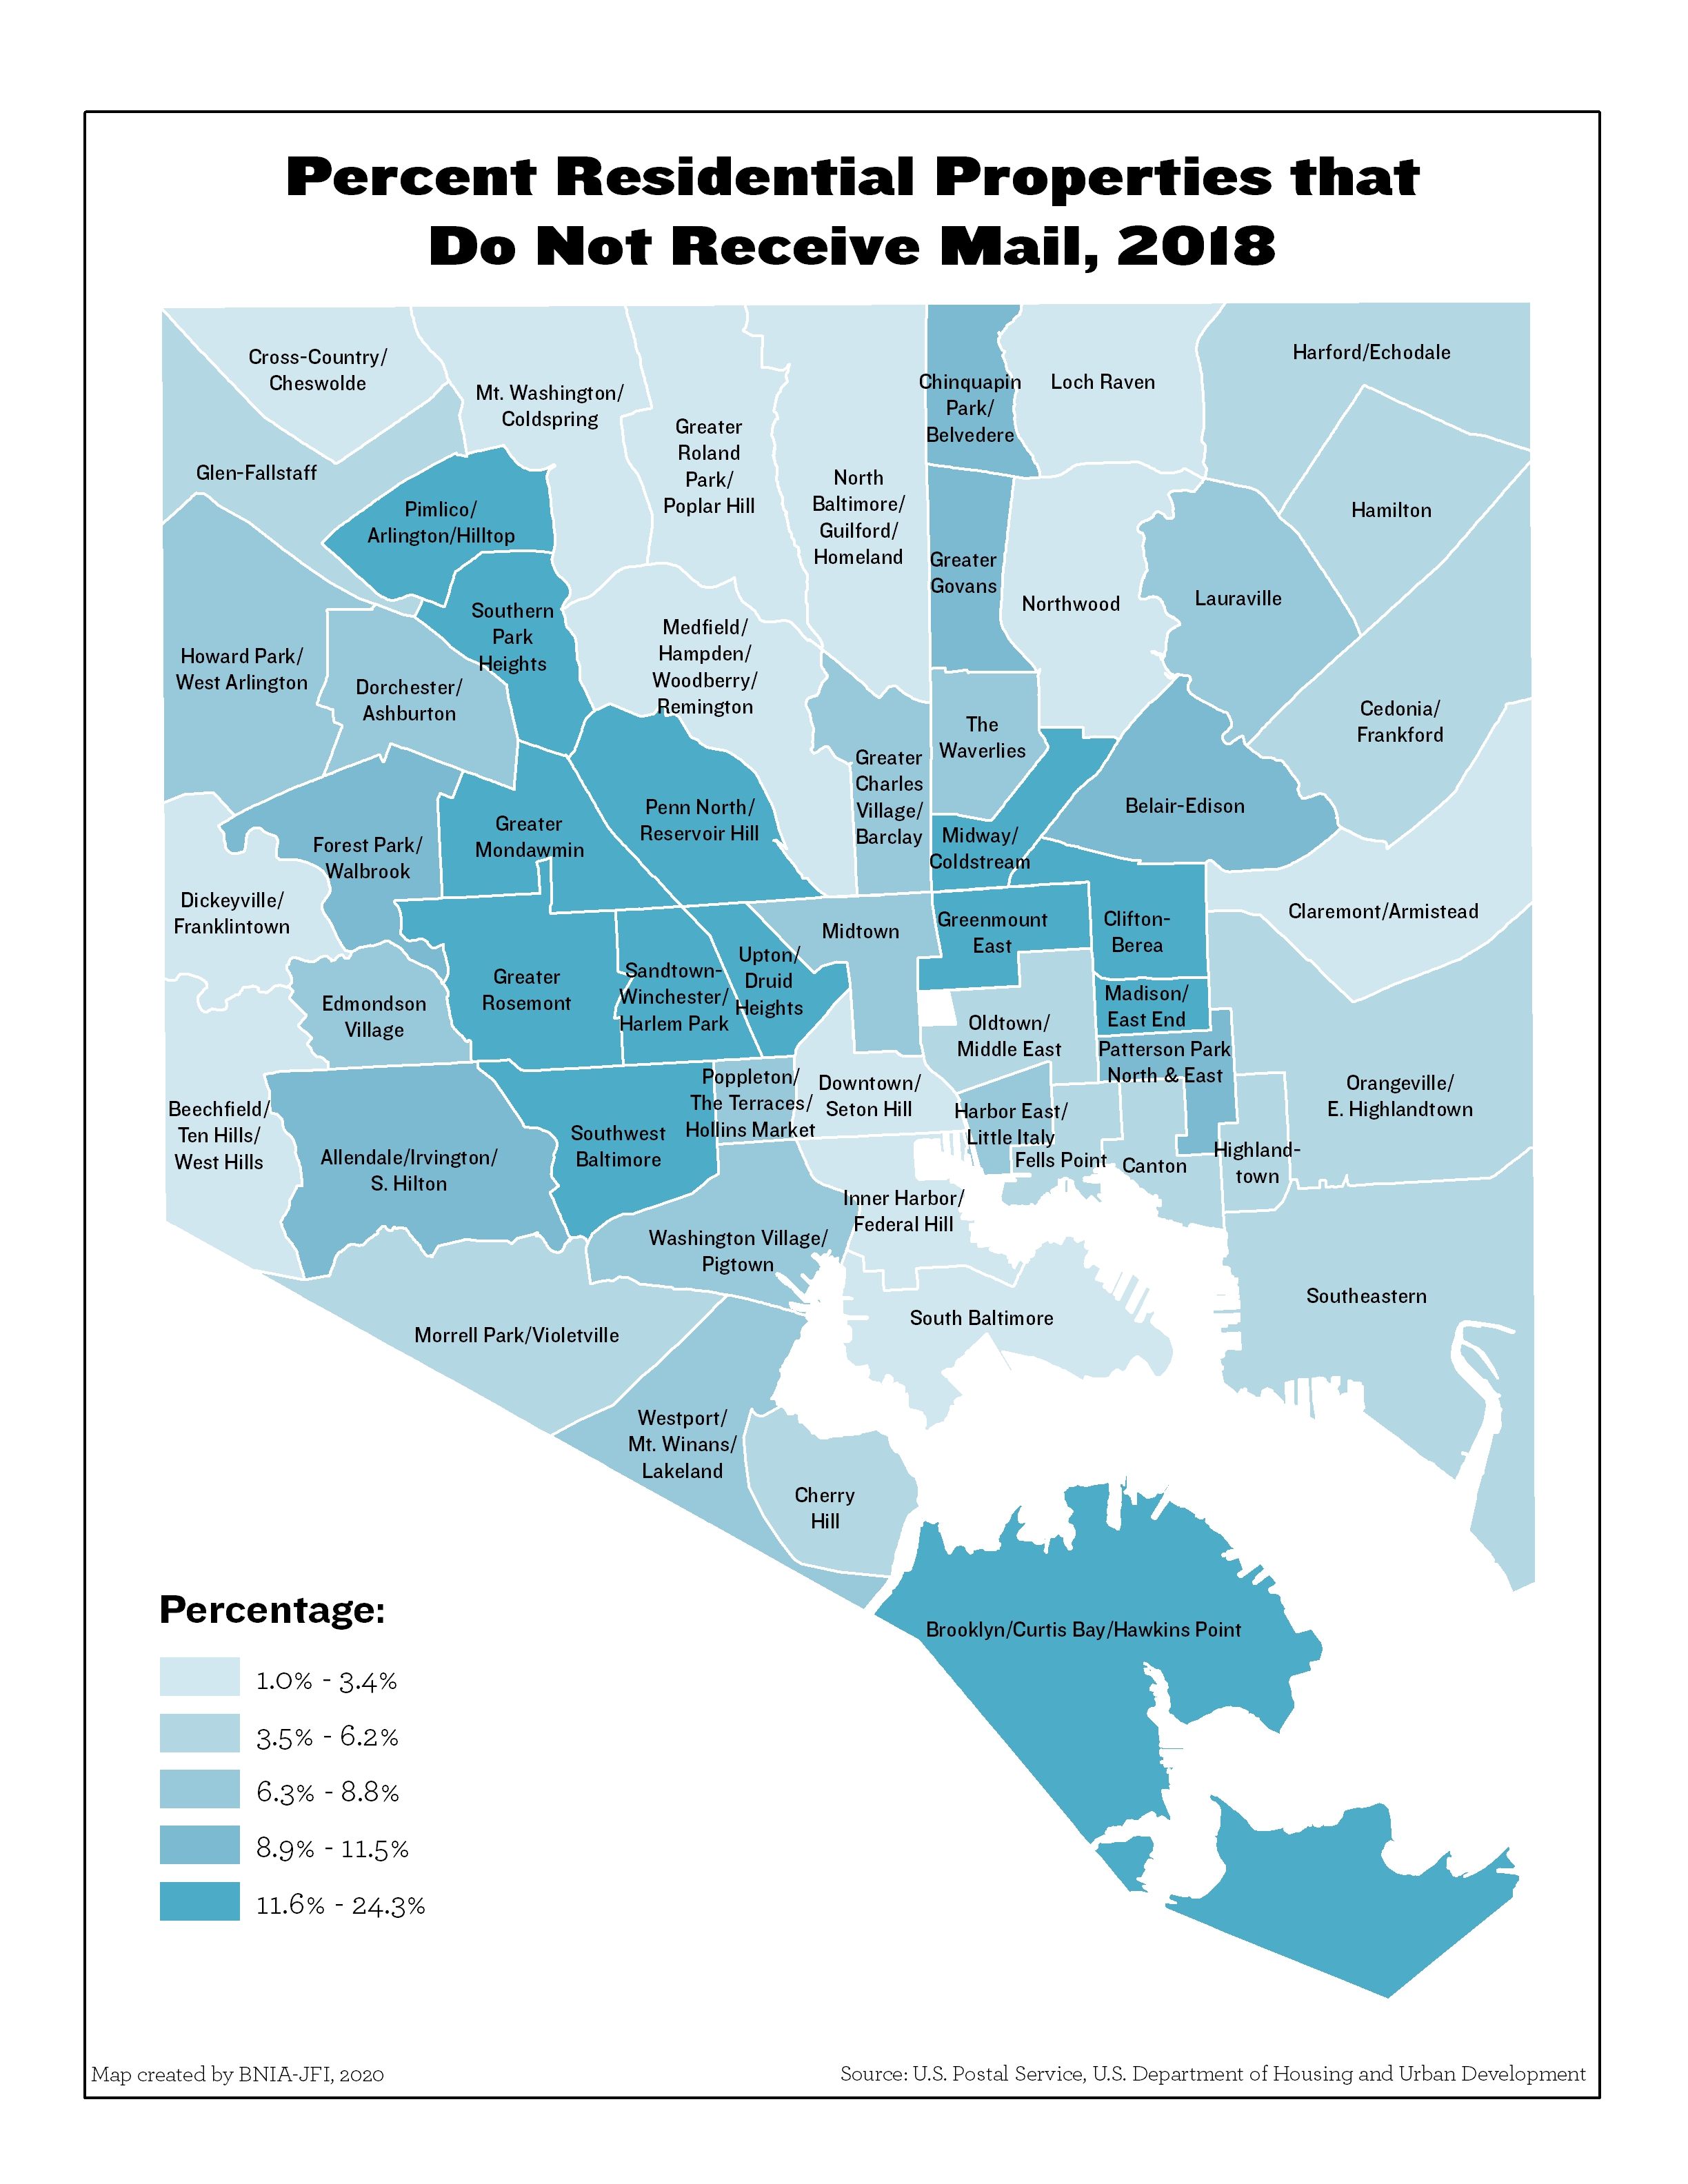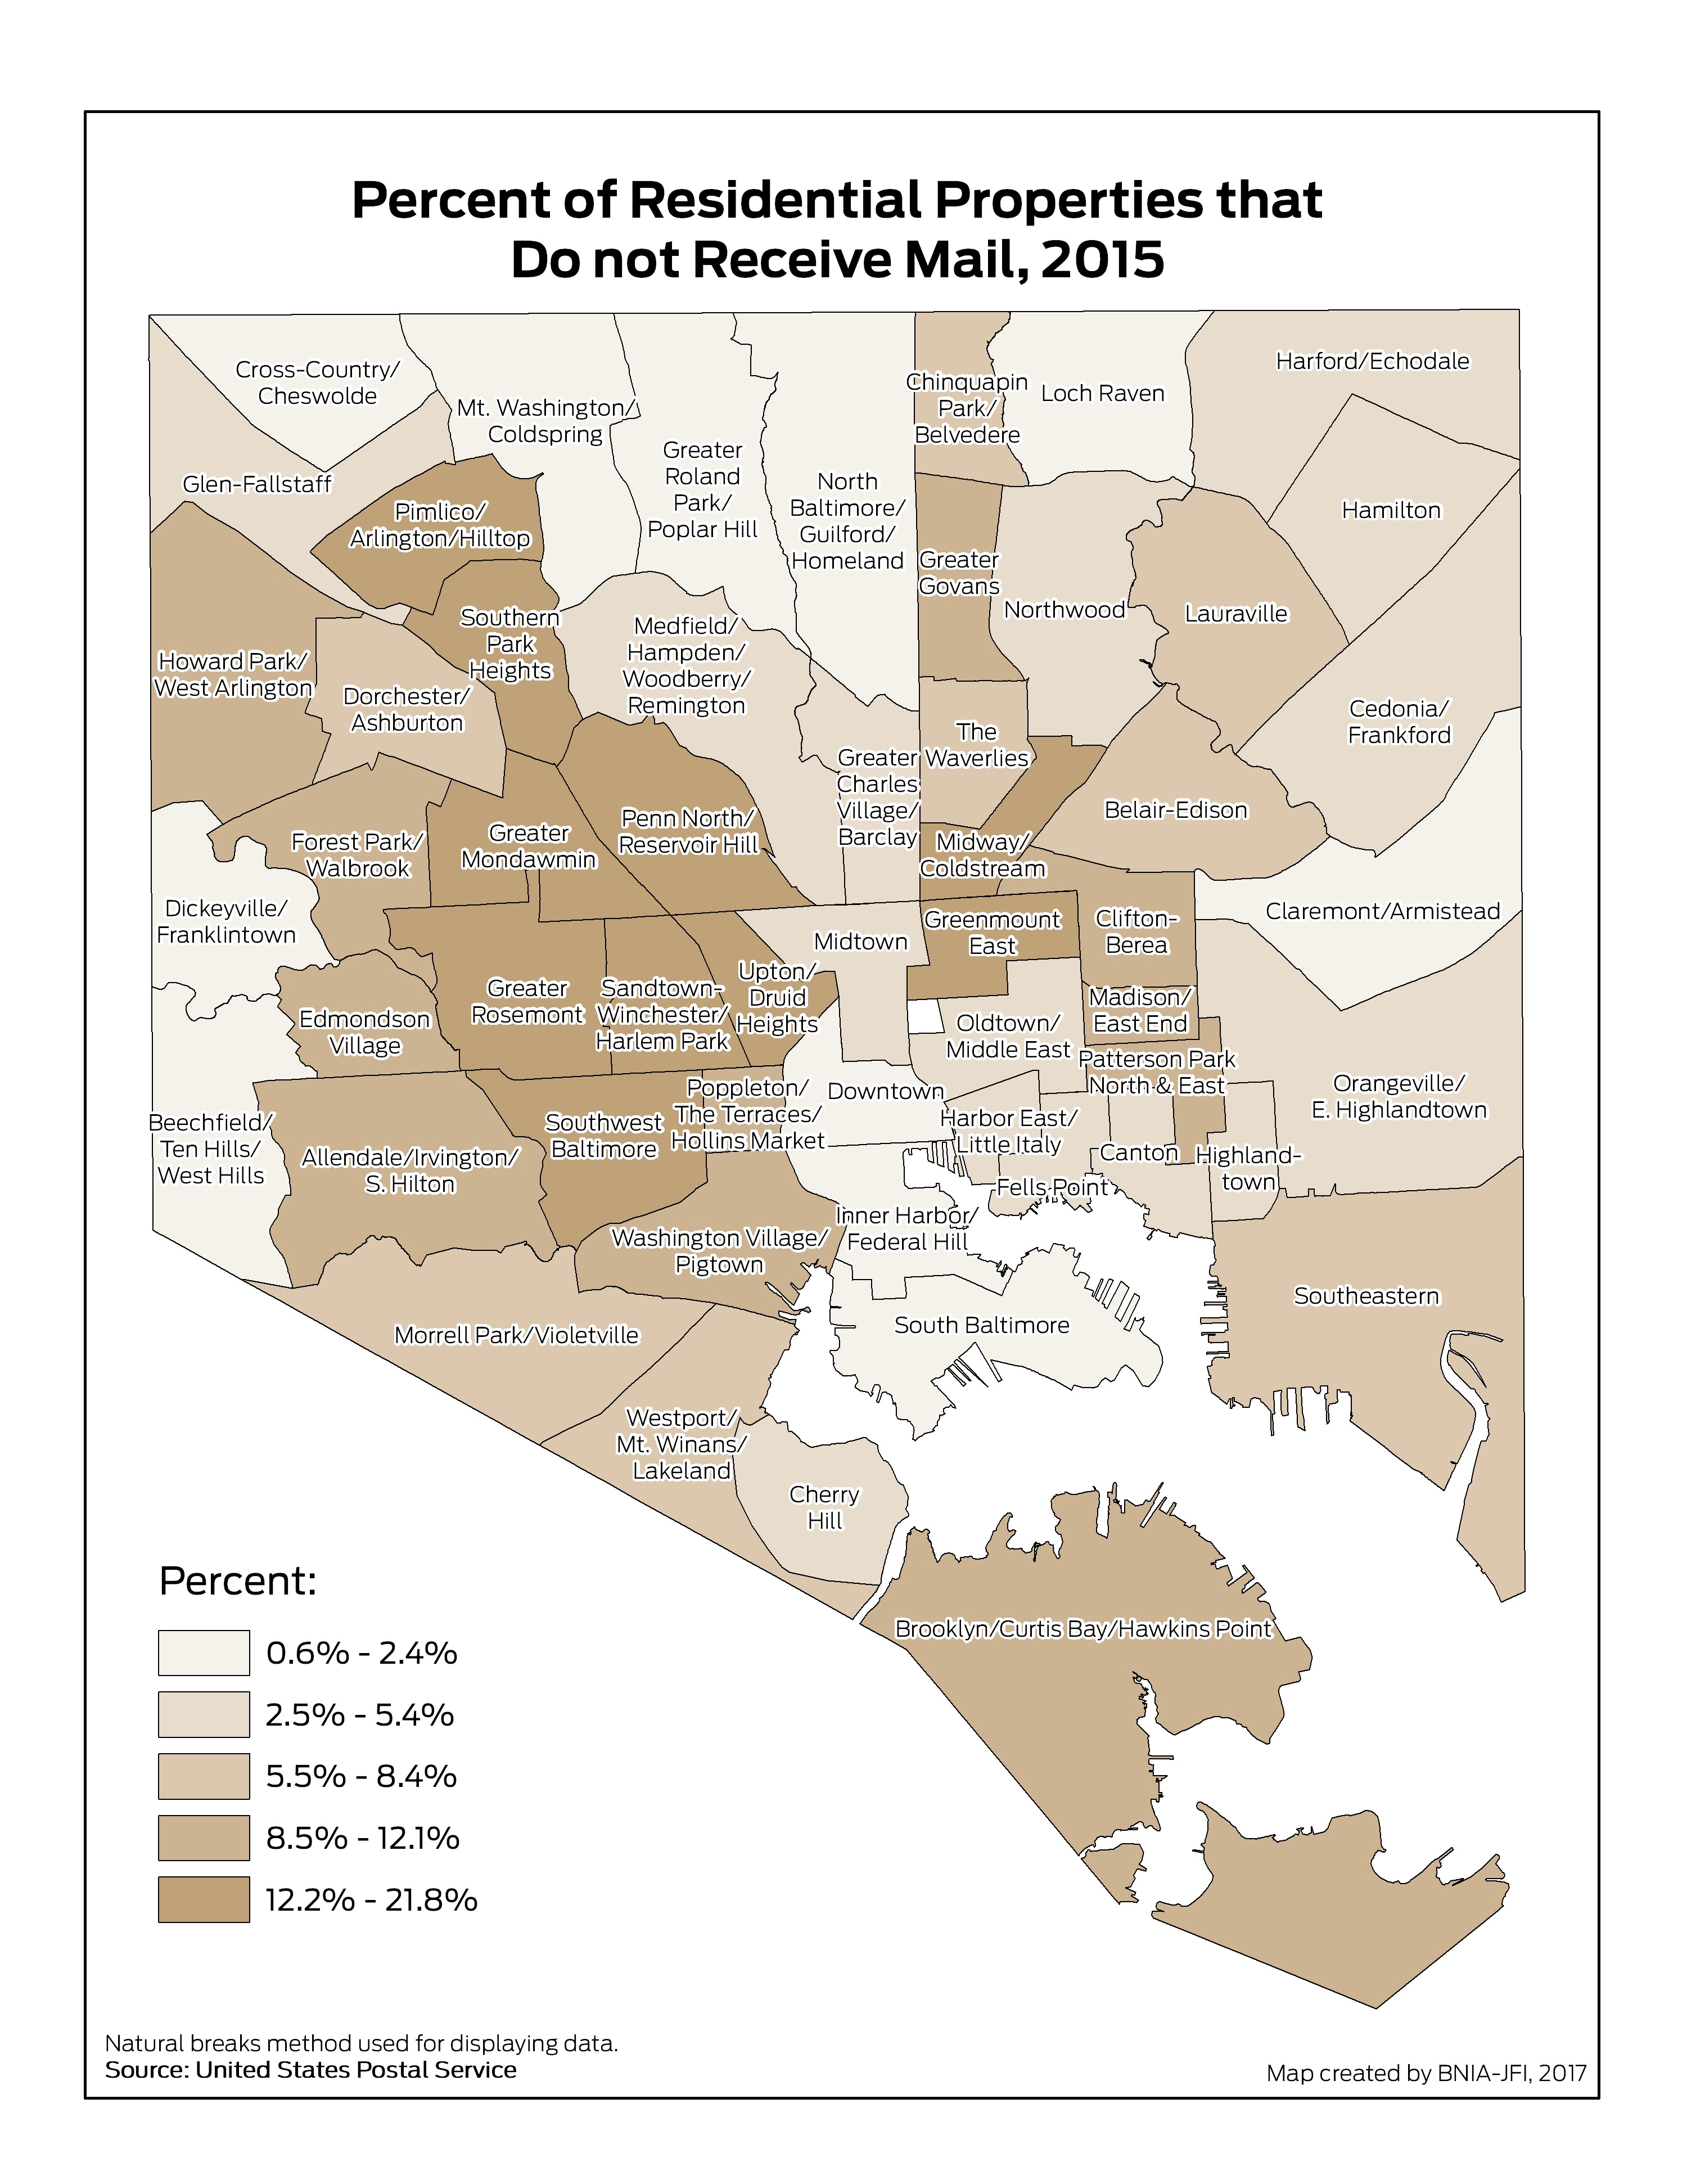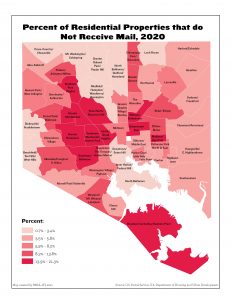
Percent of Residential Properties that do Not Receive Mail (2020)

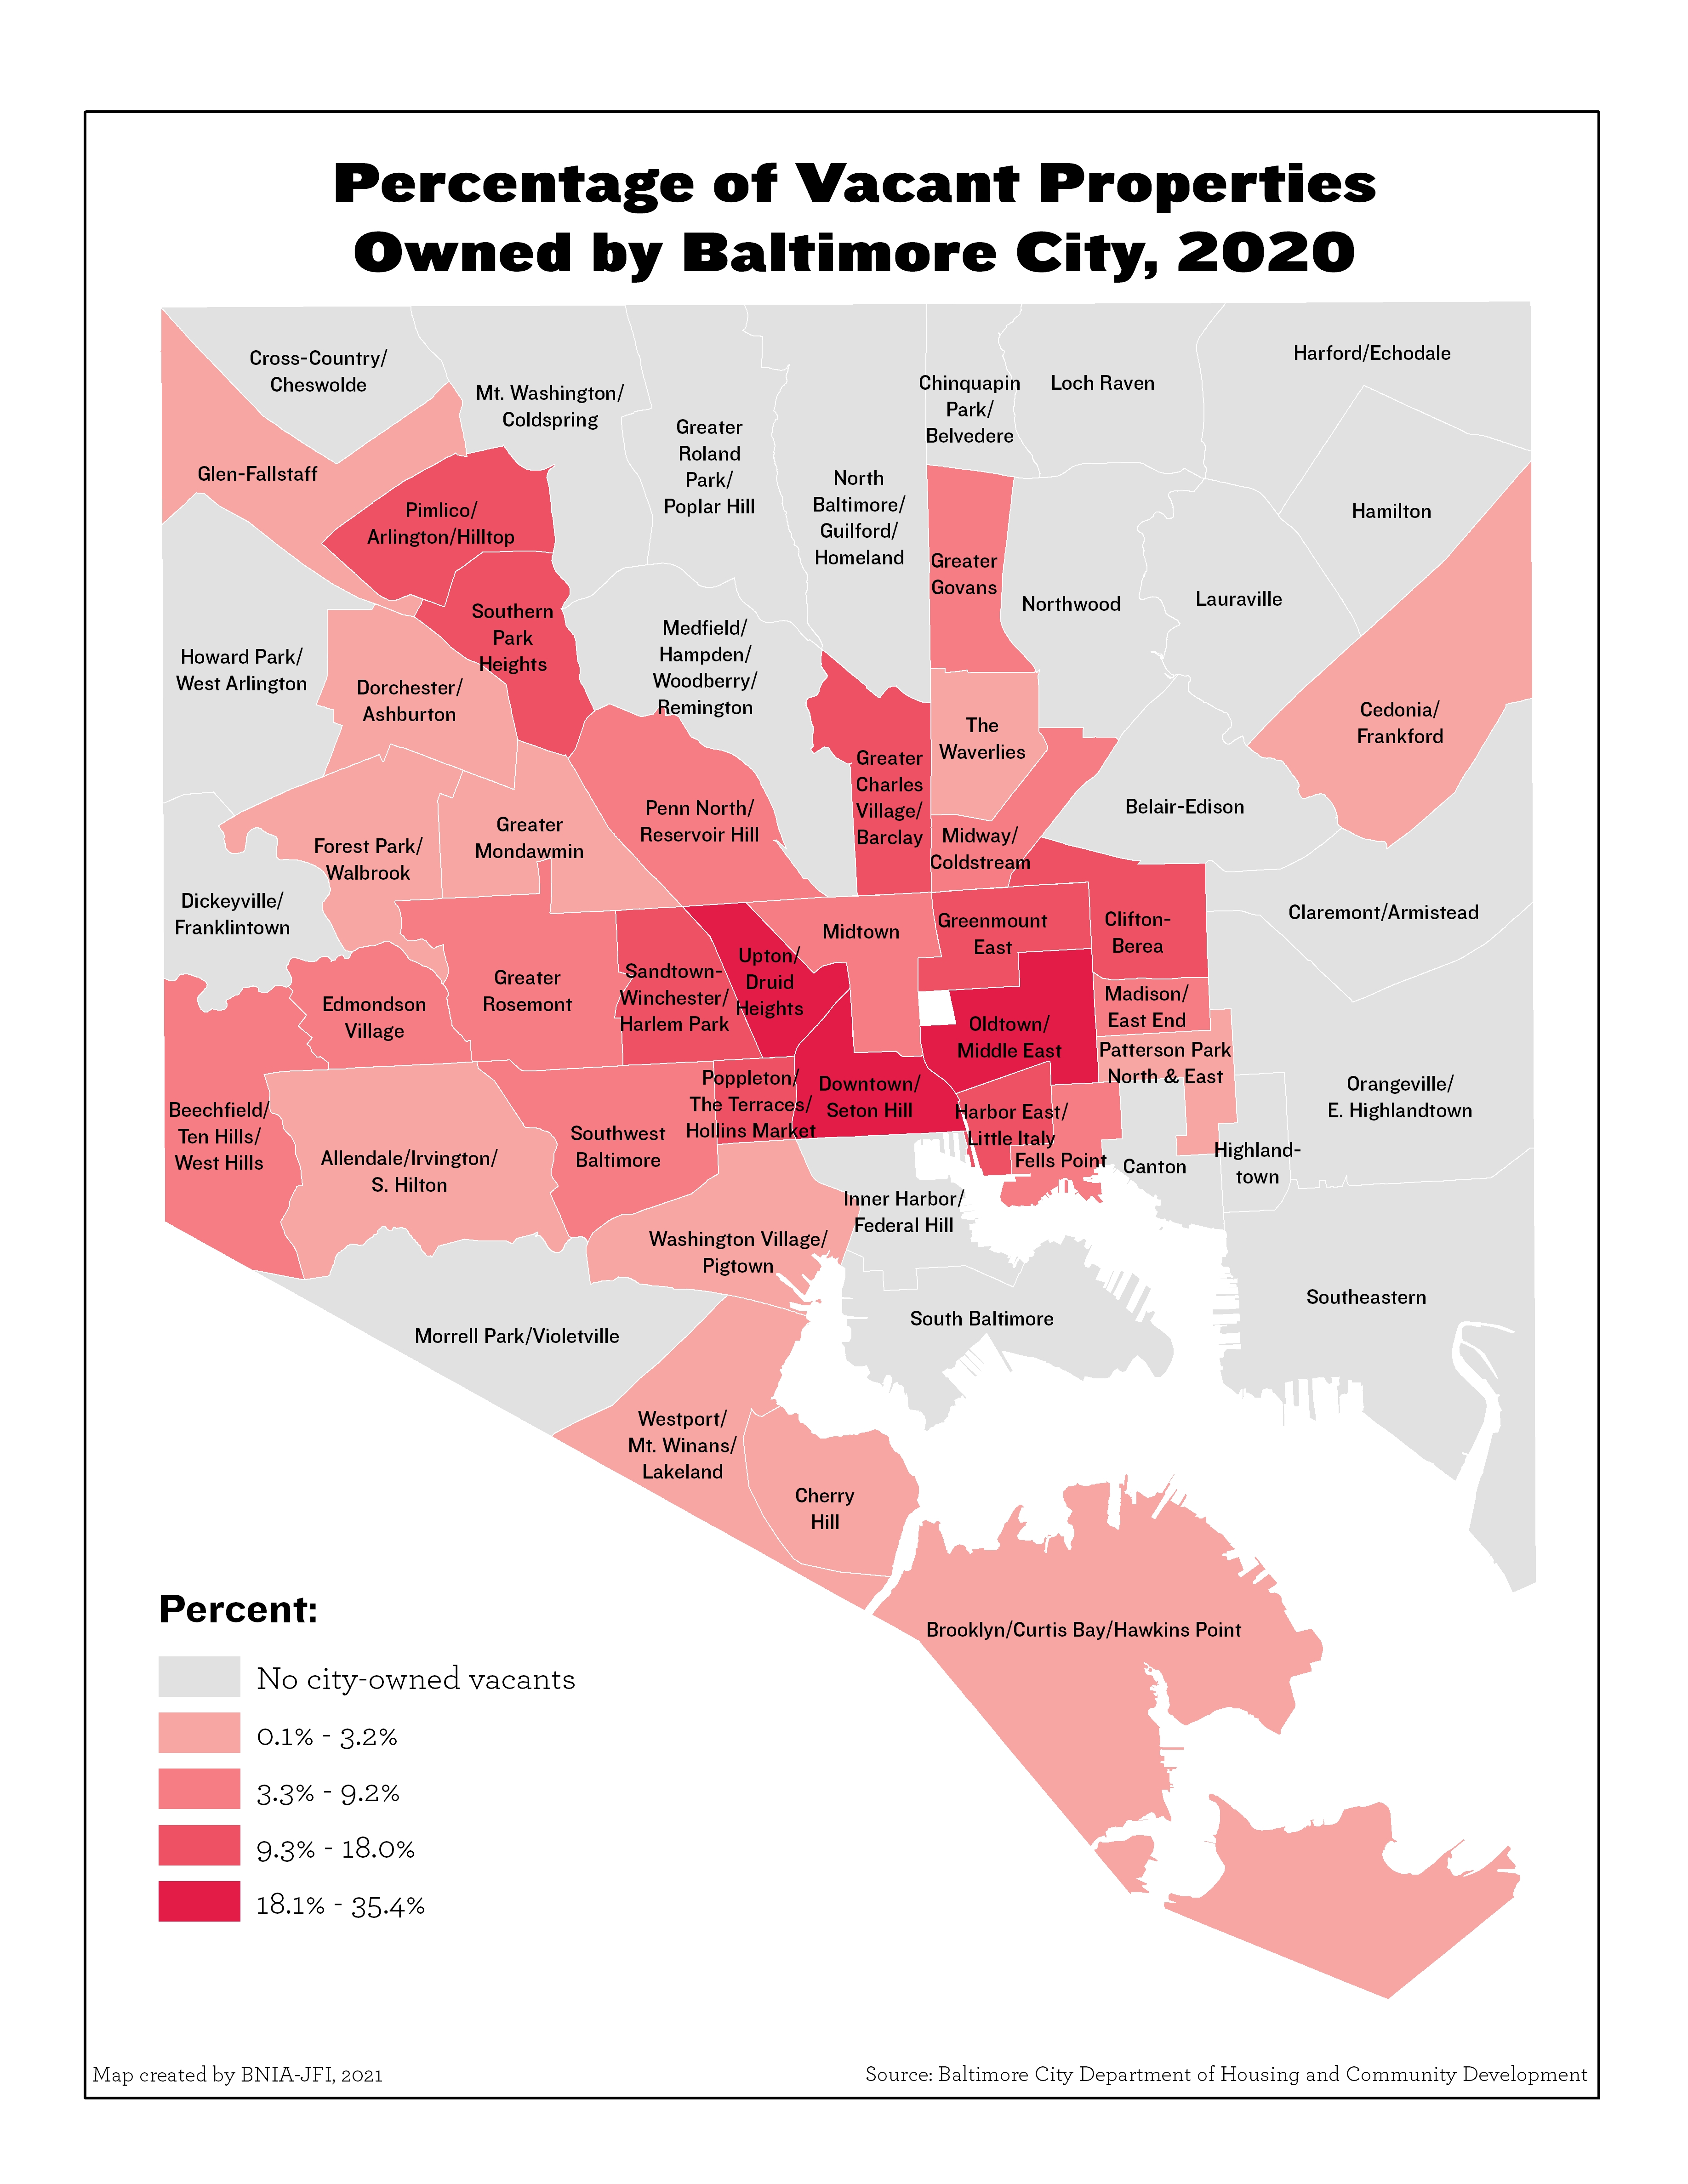
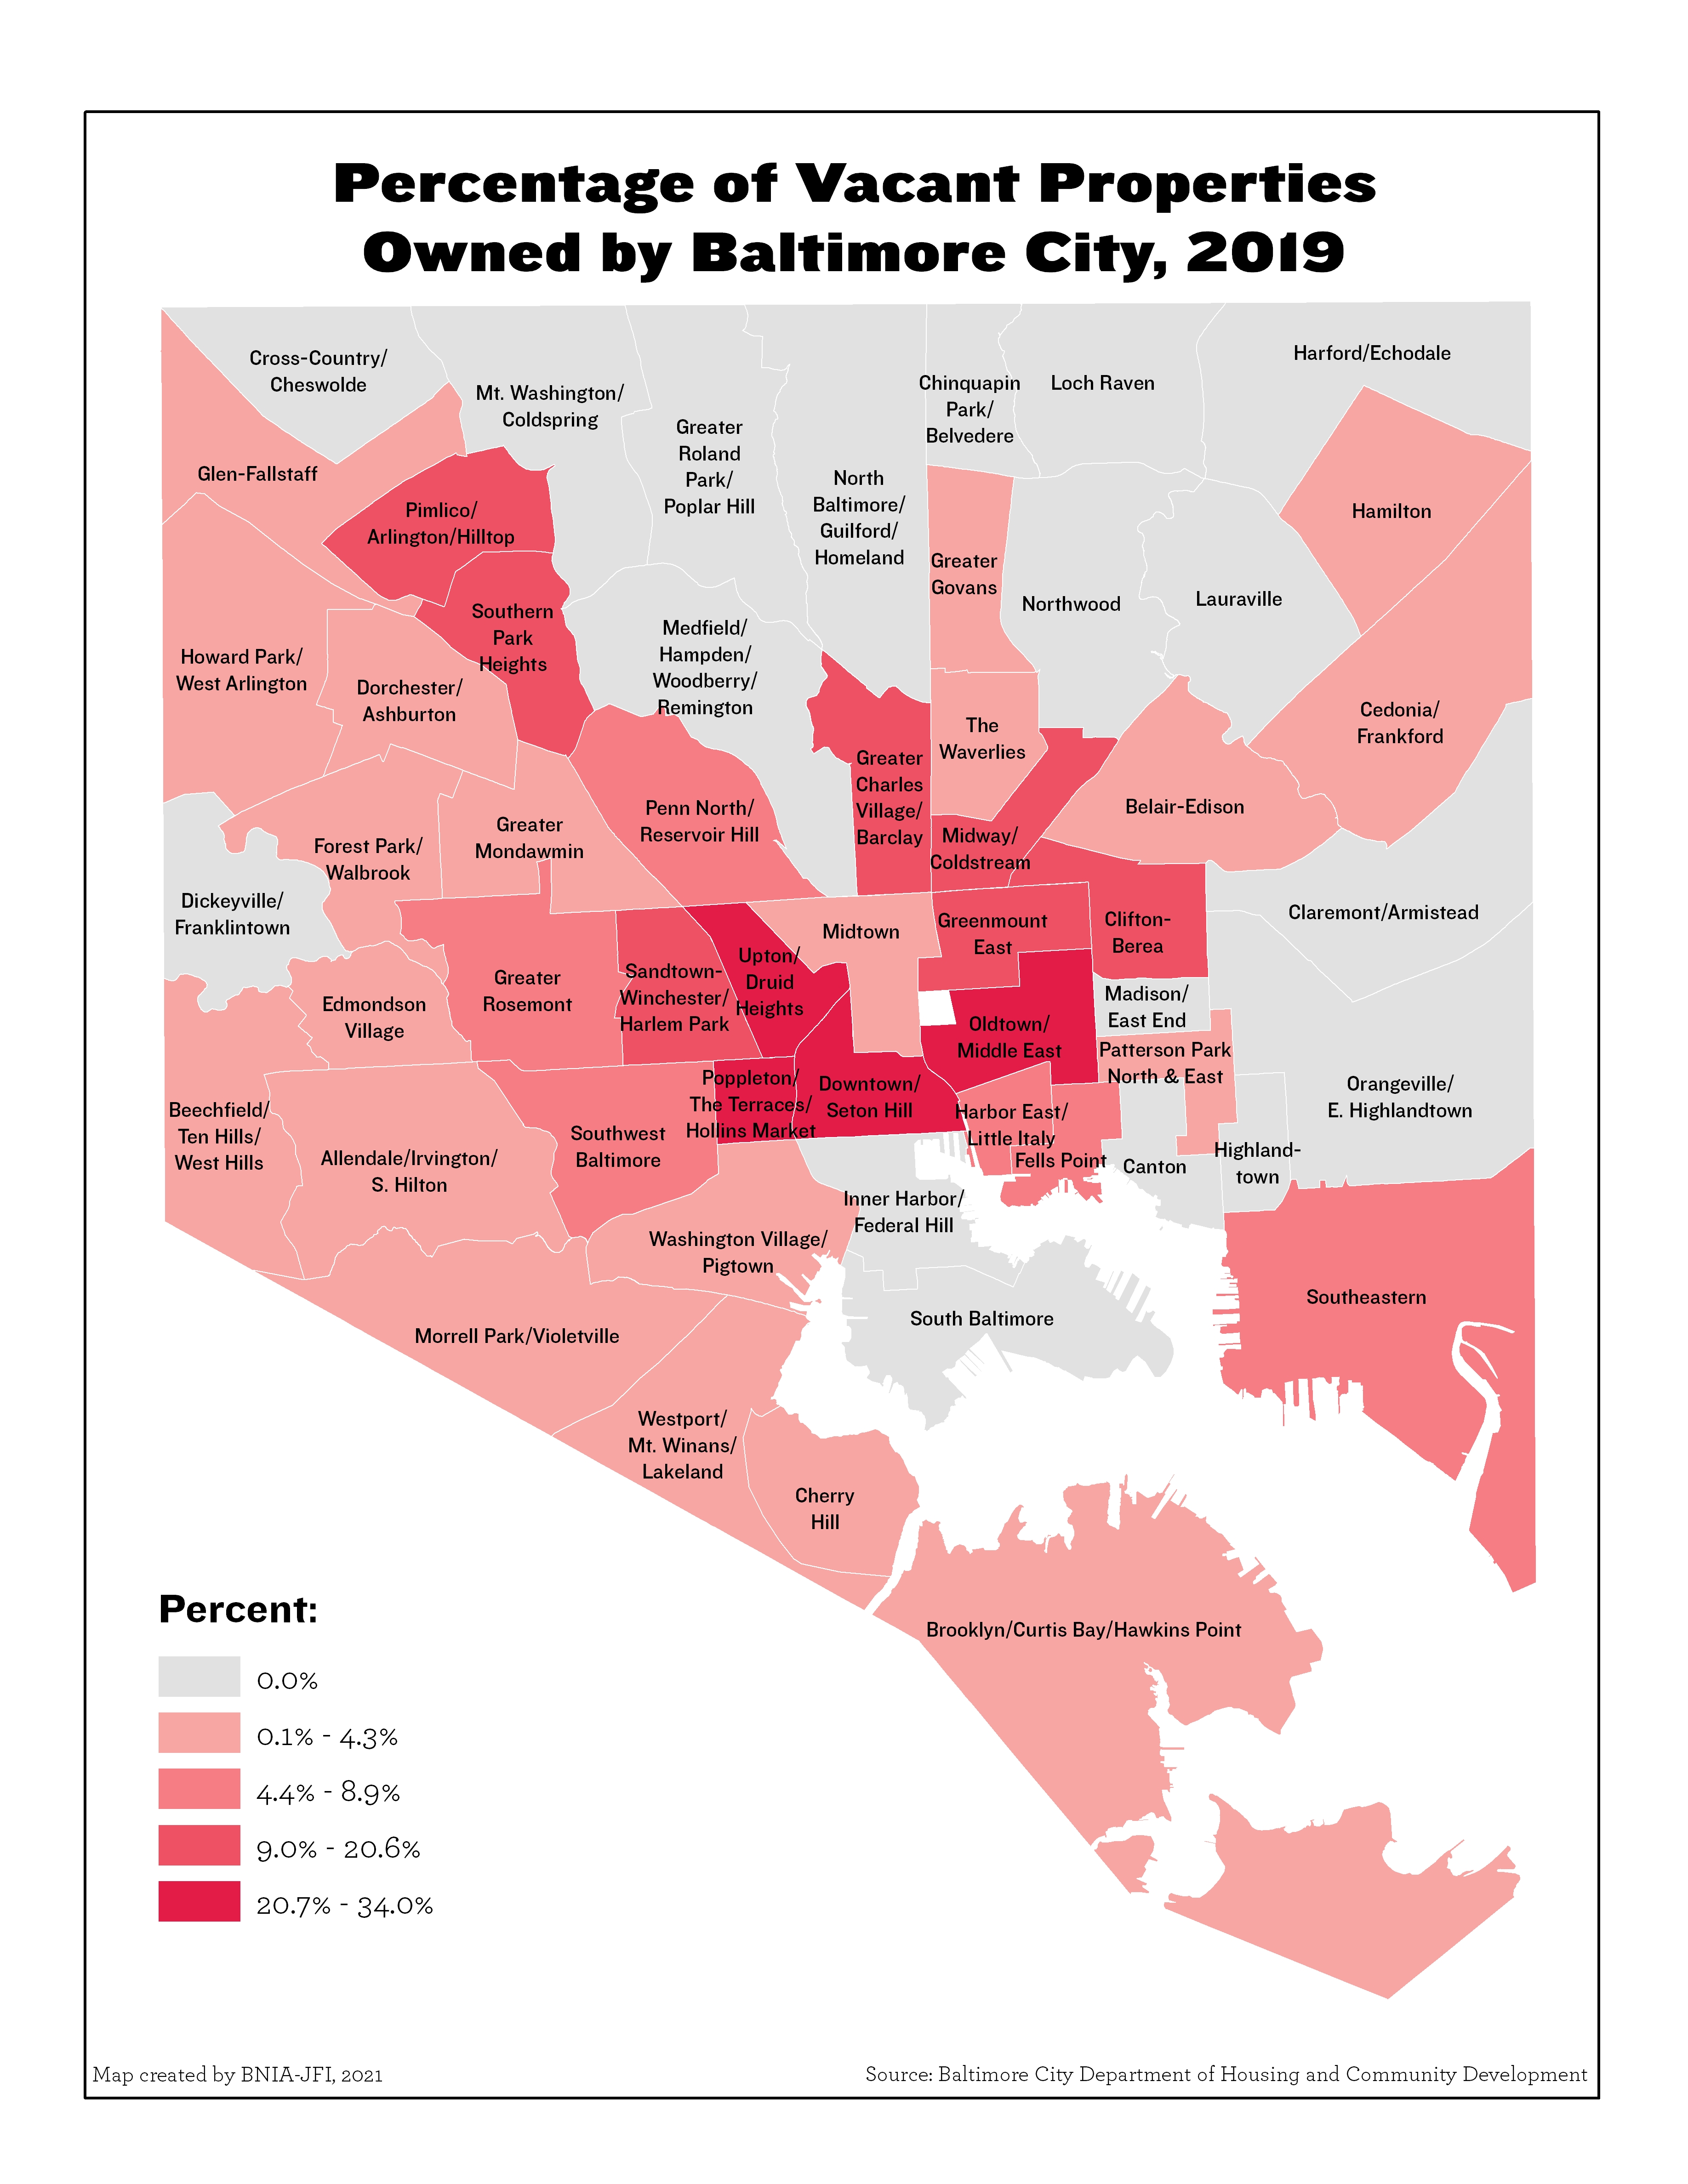
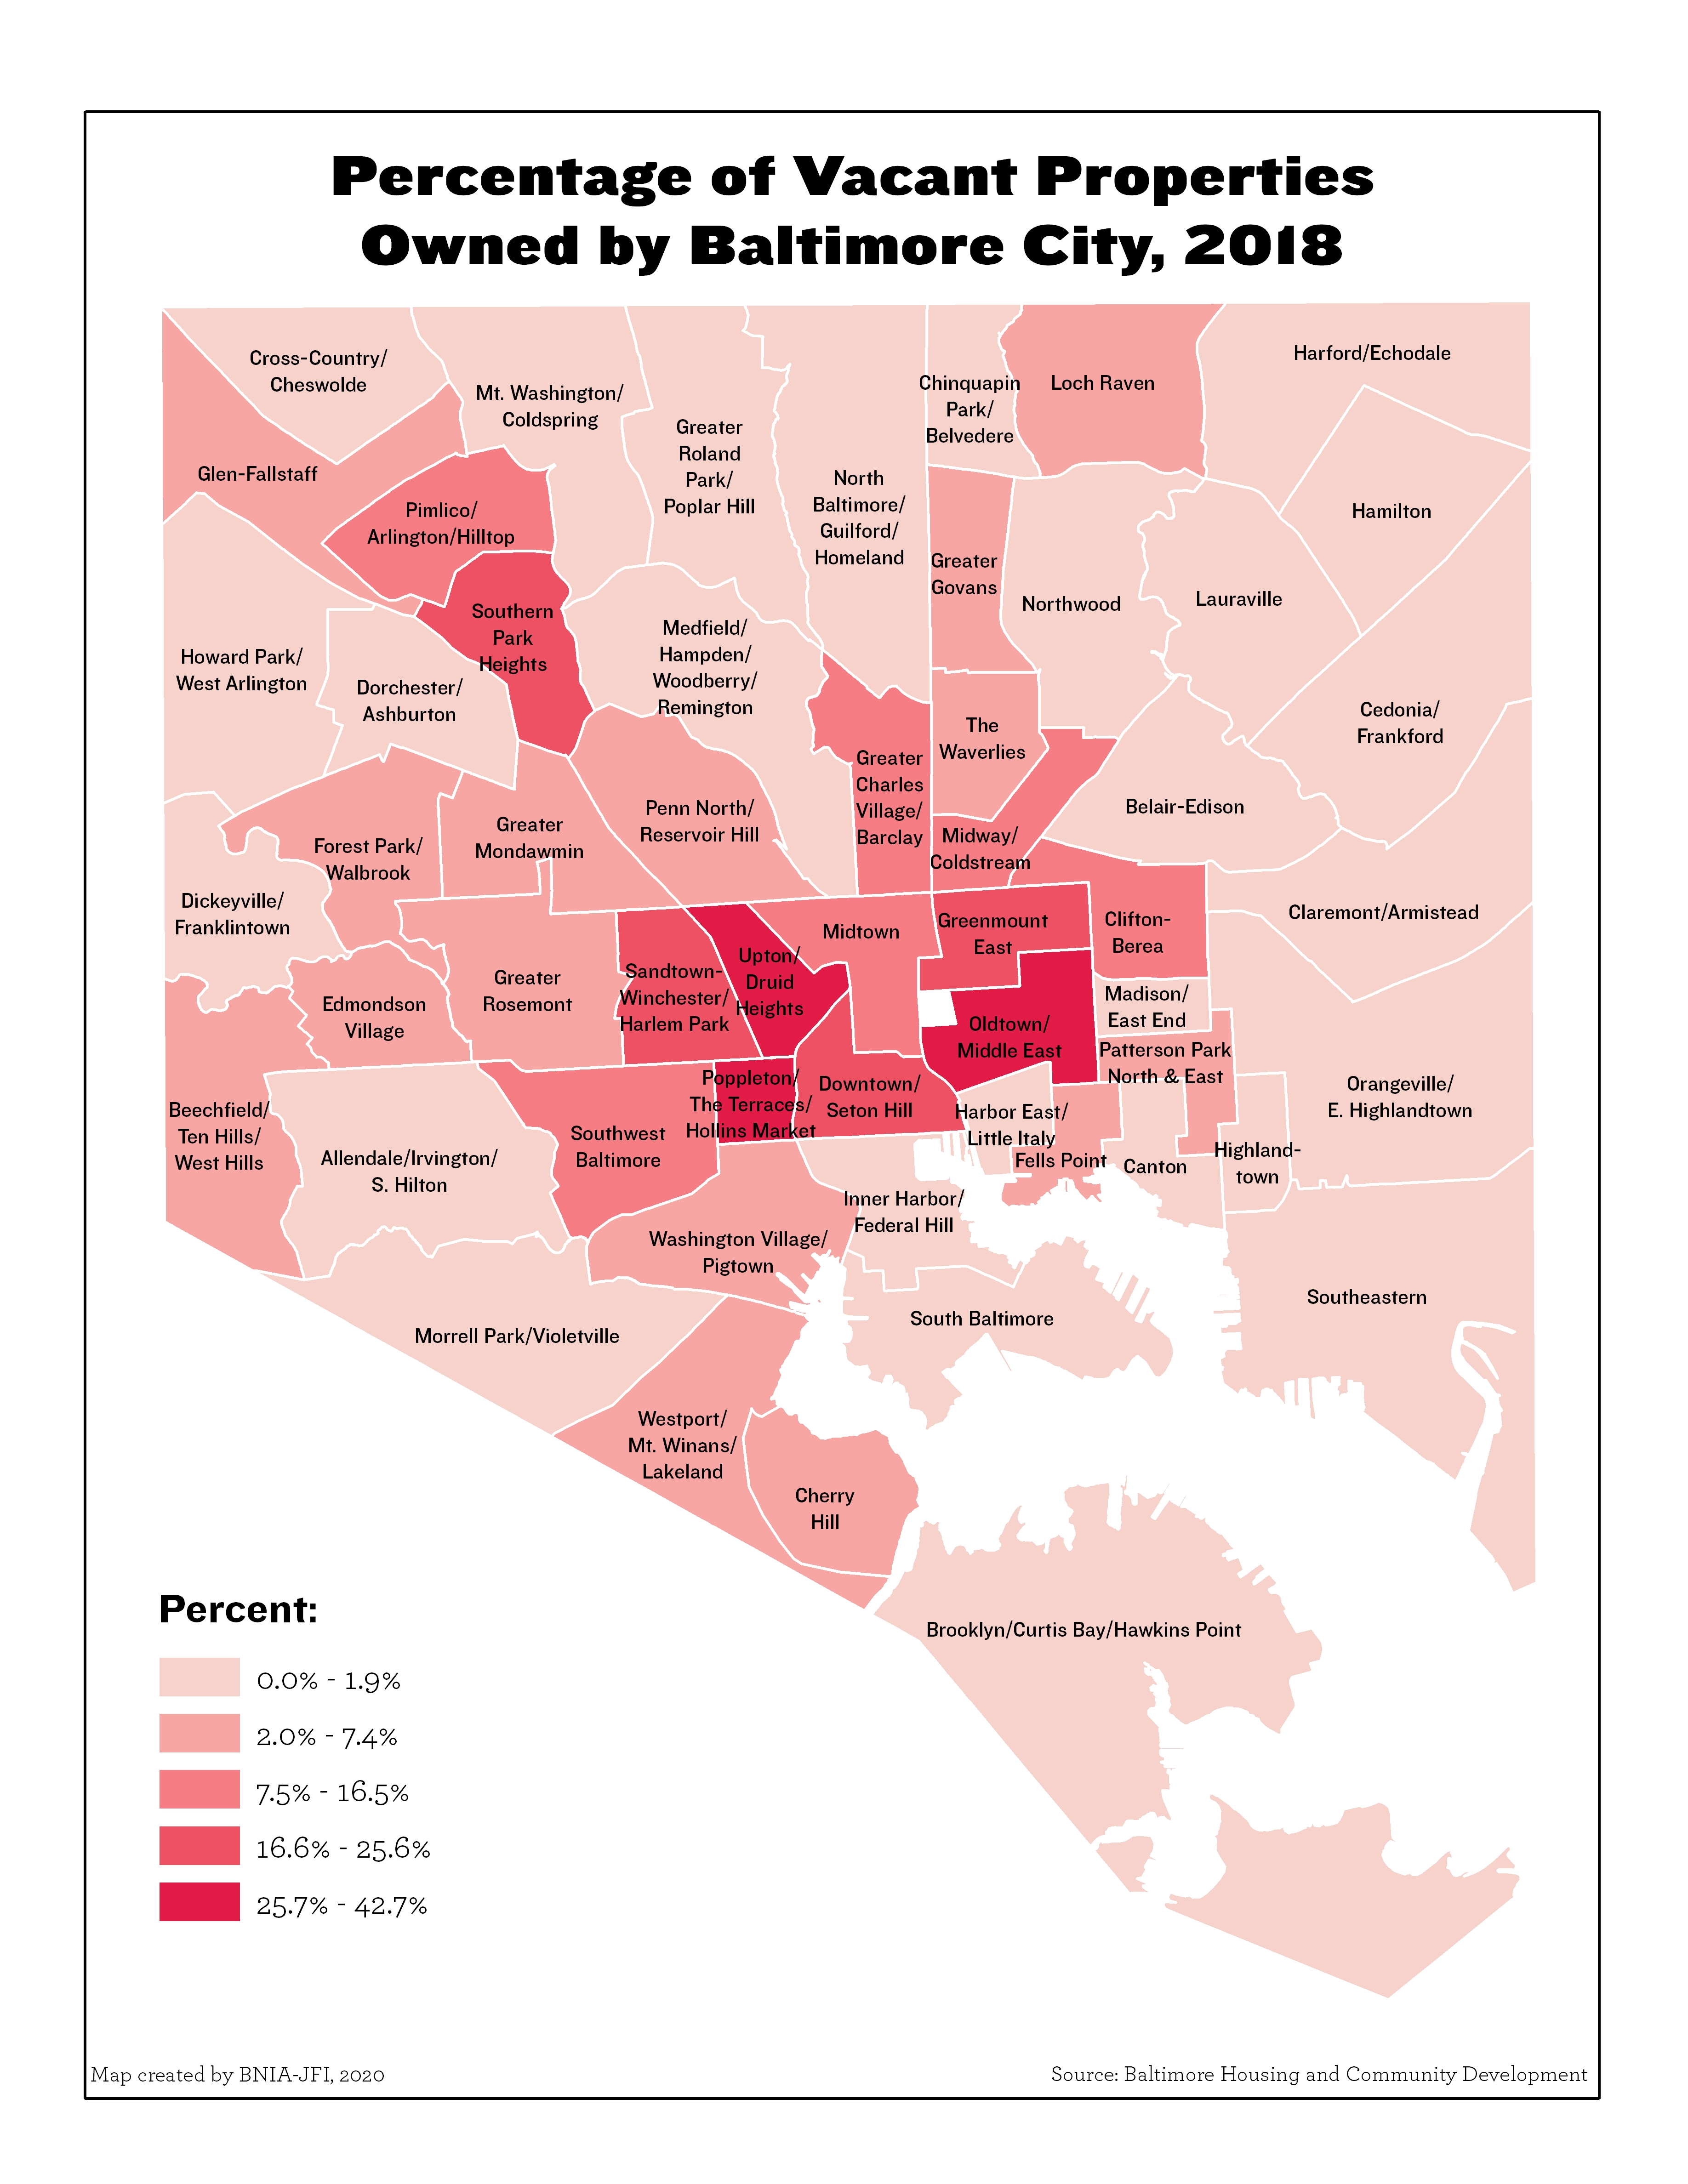
Percentage of Vacant Properties Owned by Baltimore City (2020)
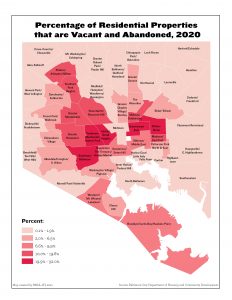
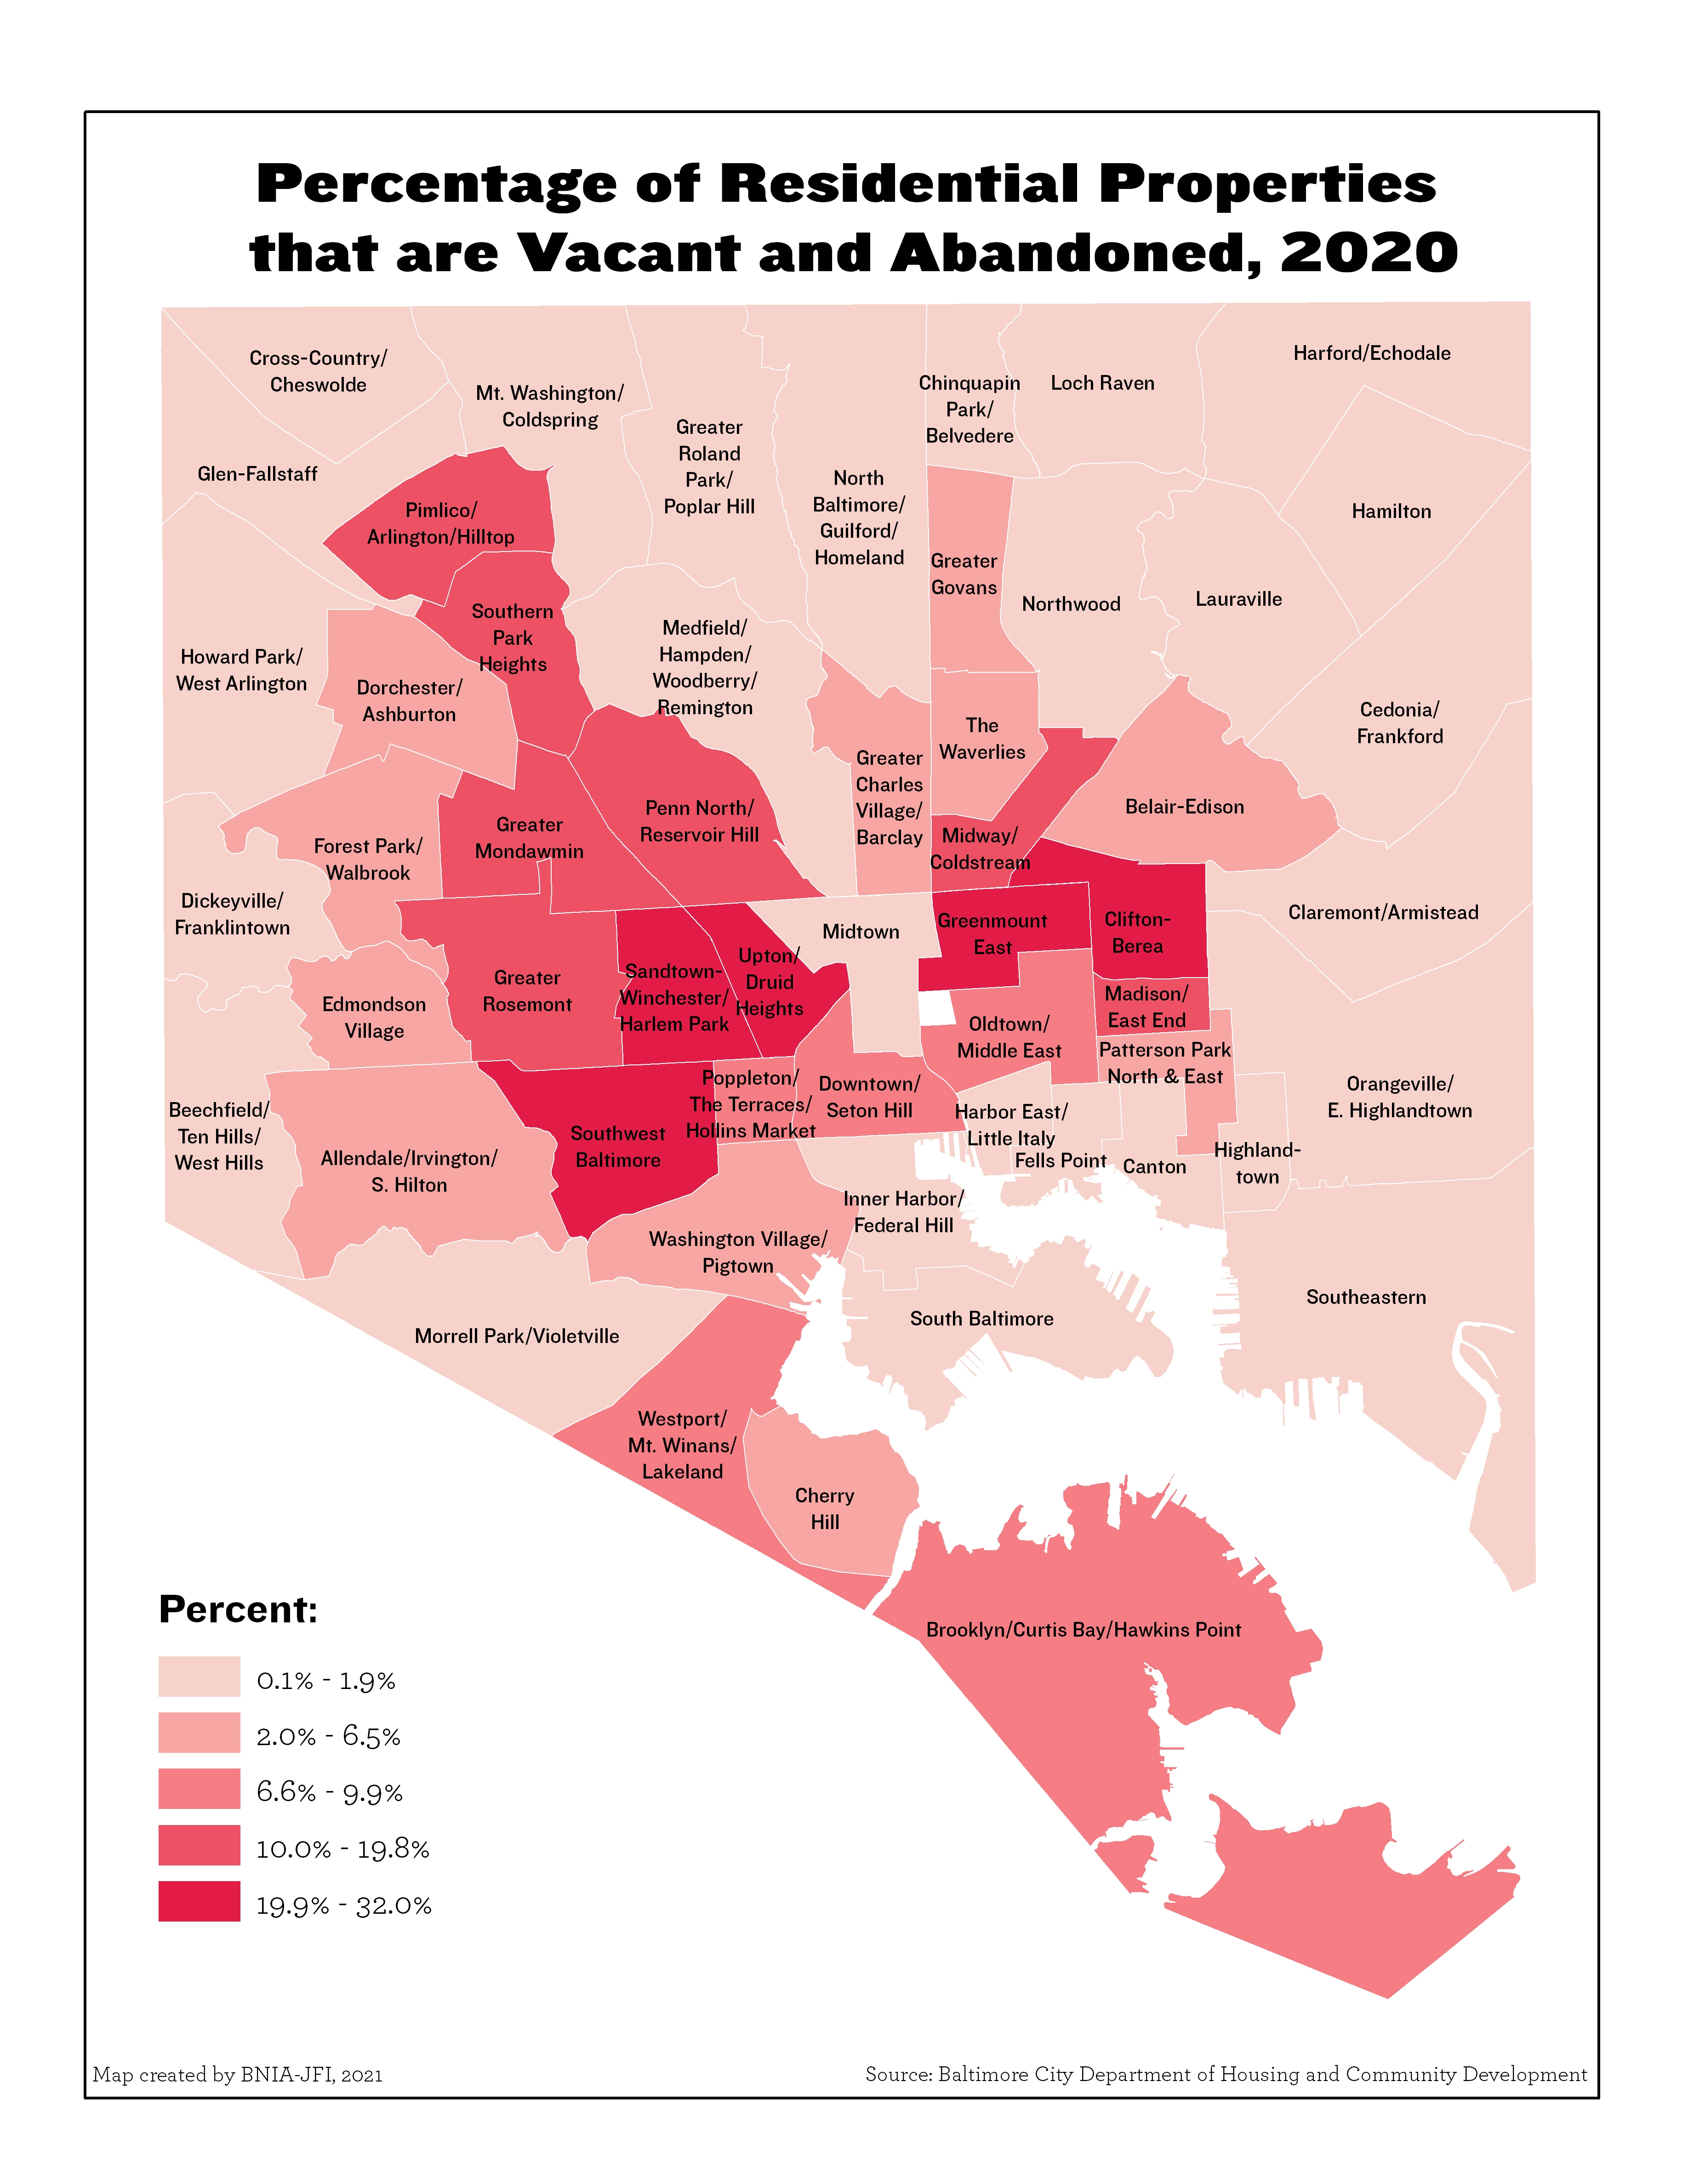
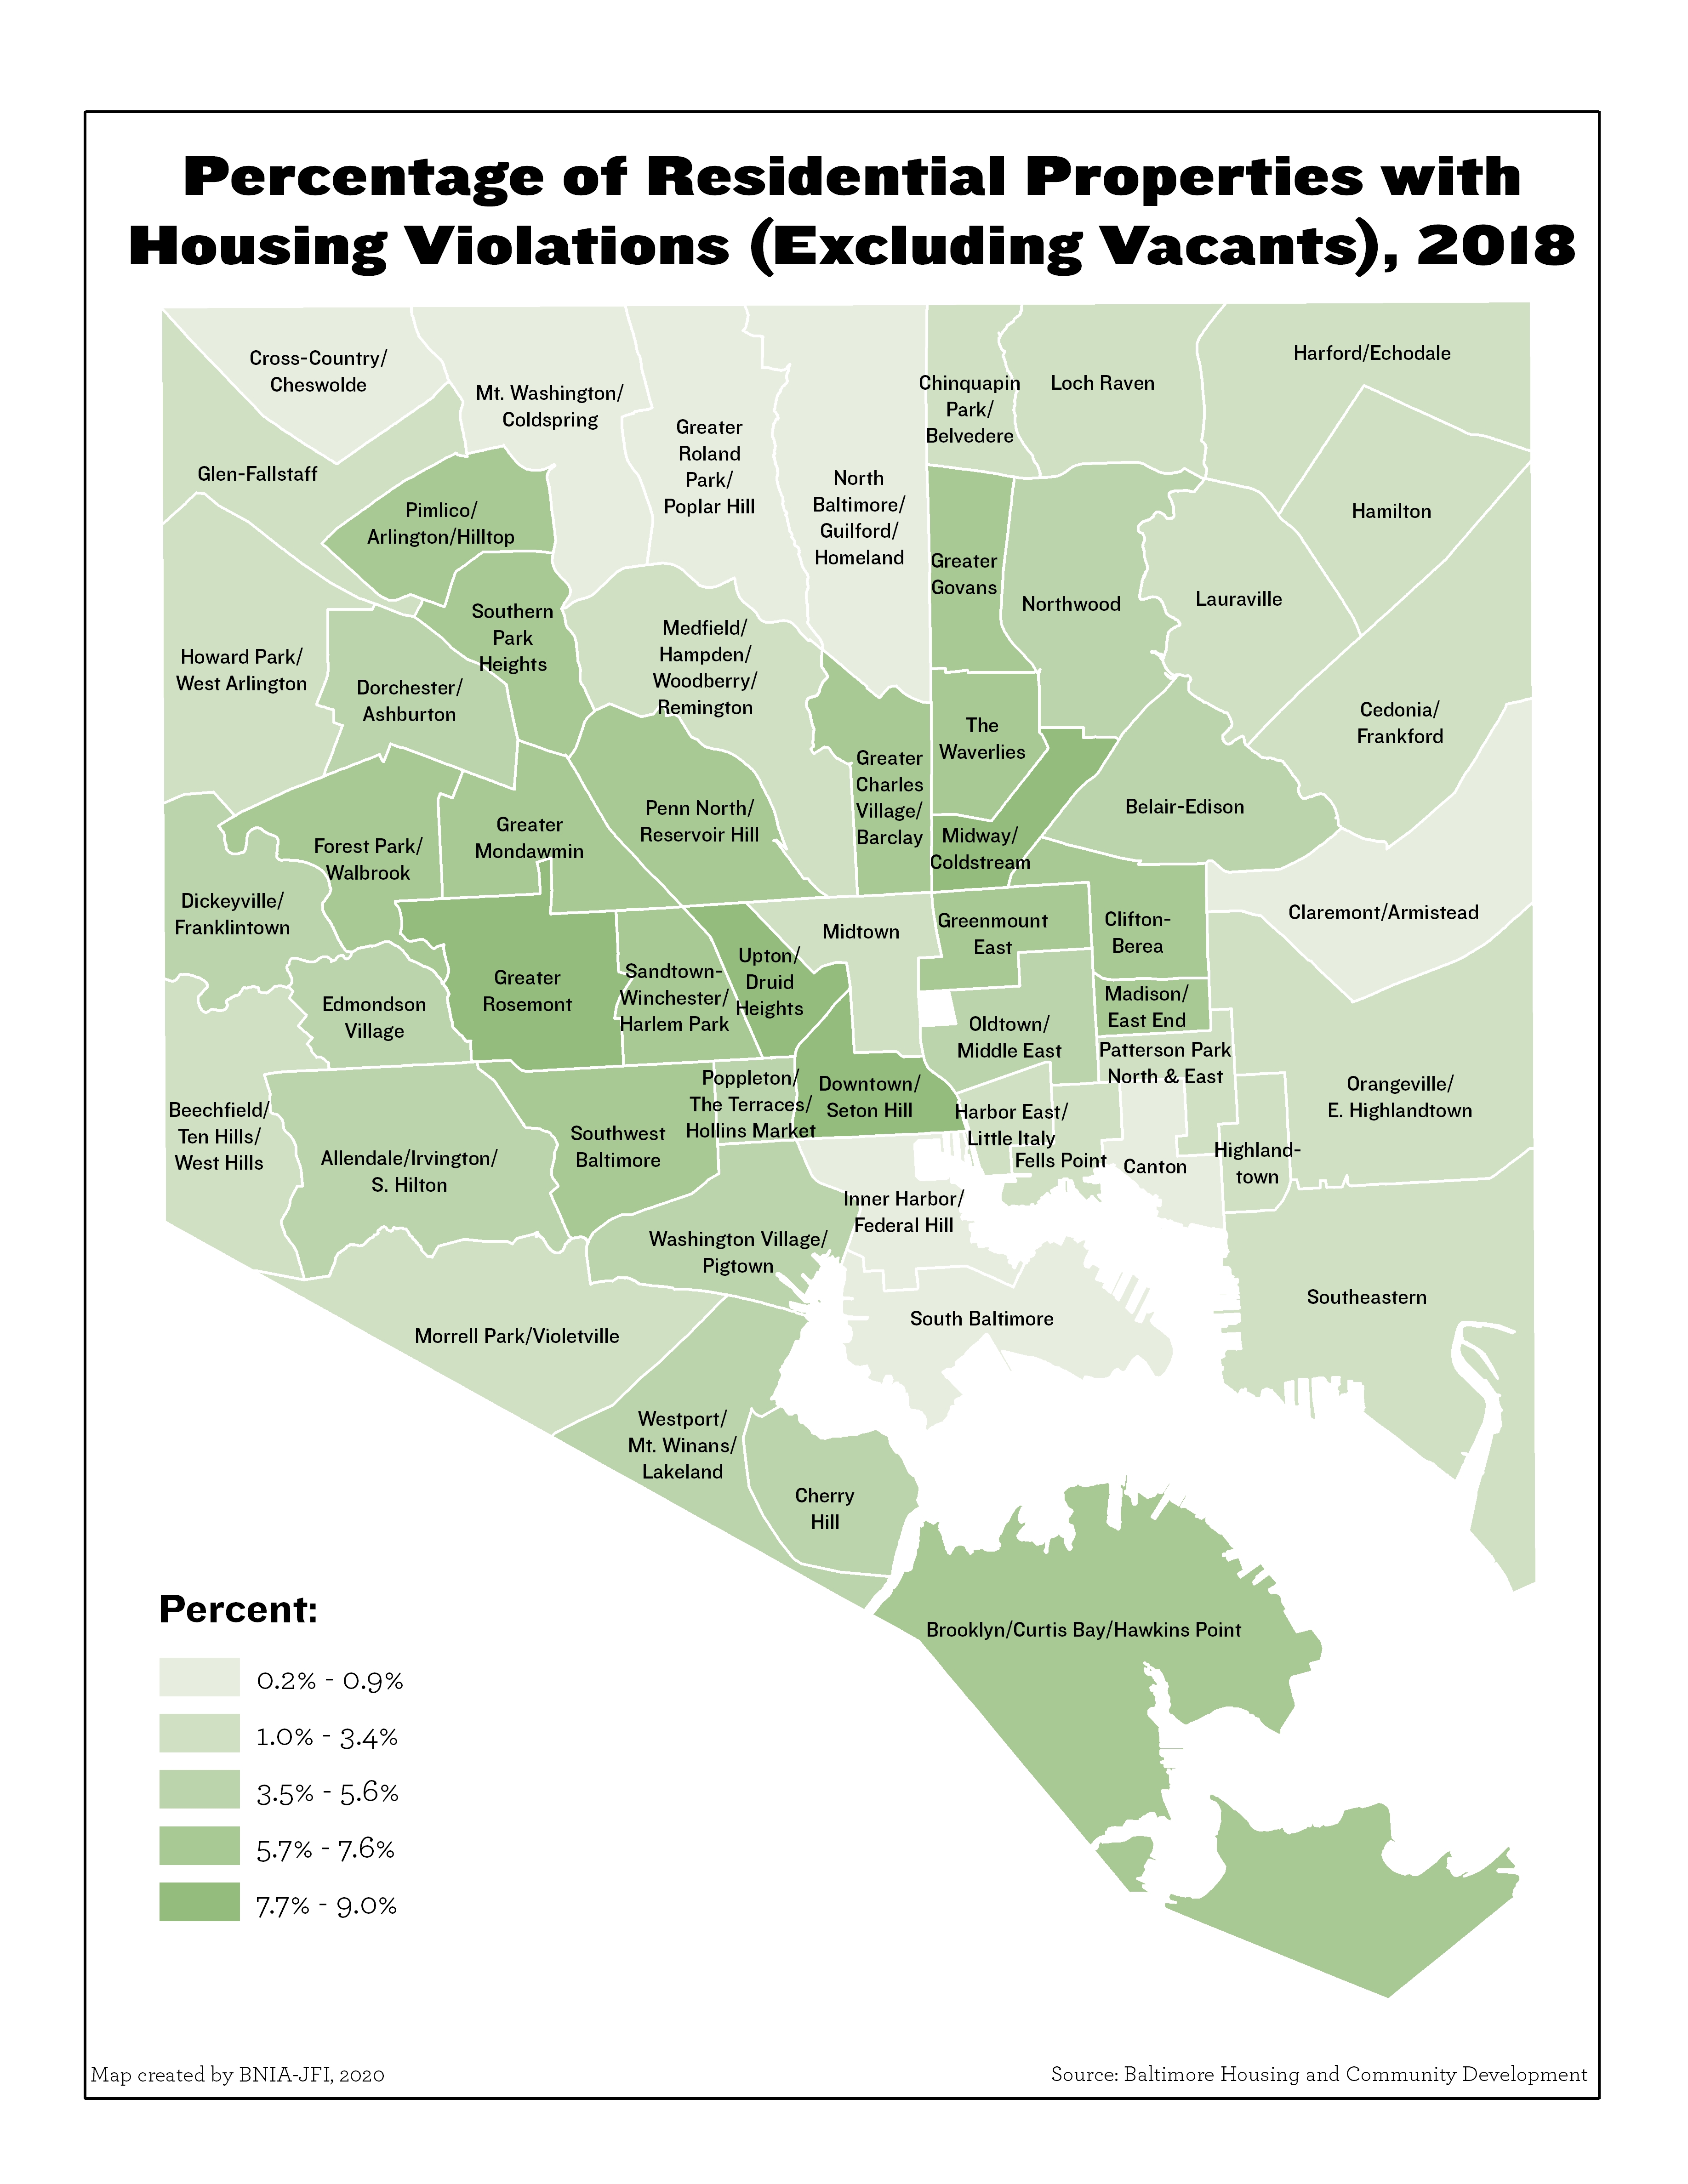
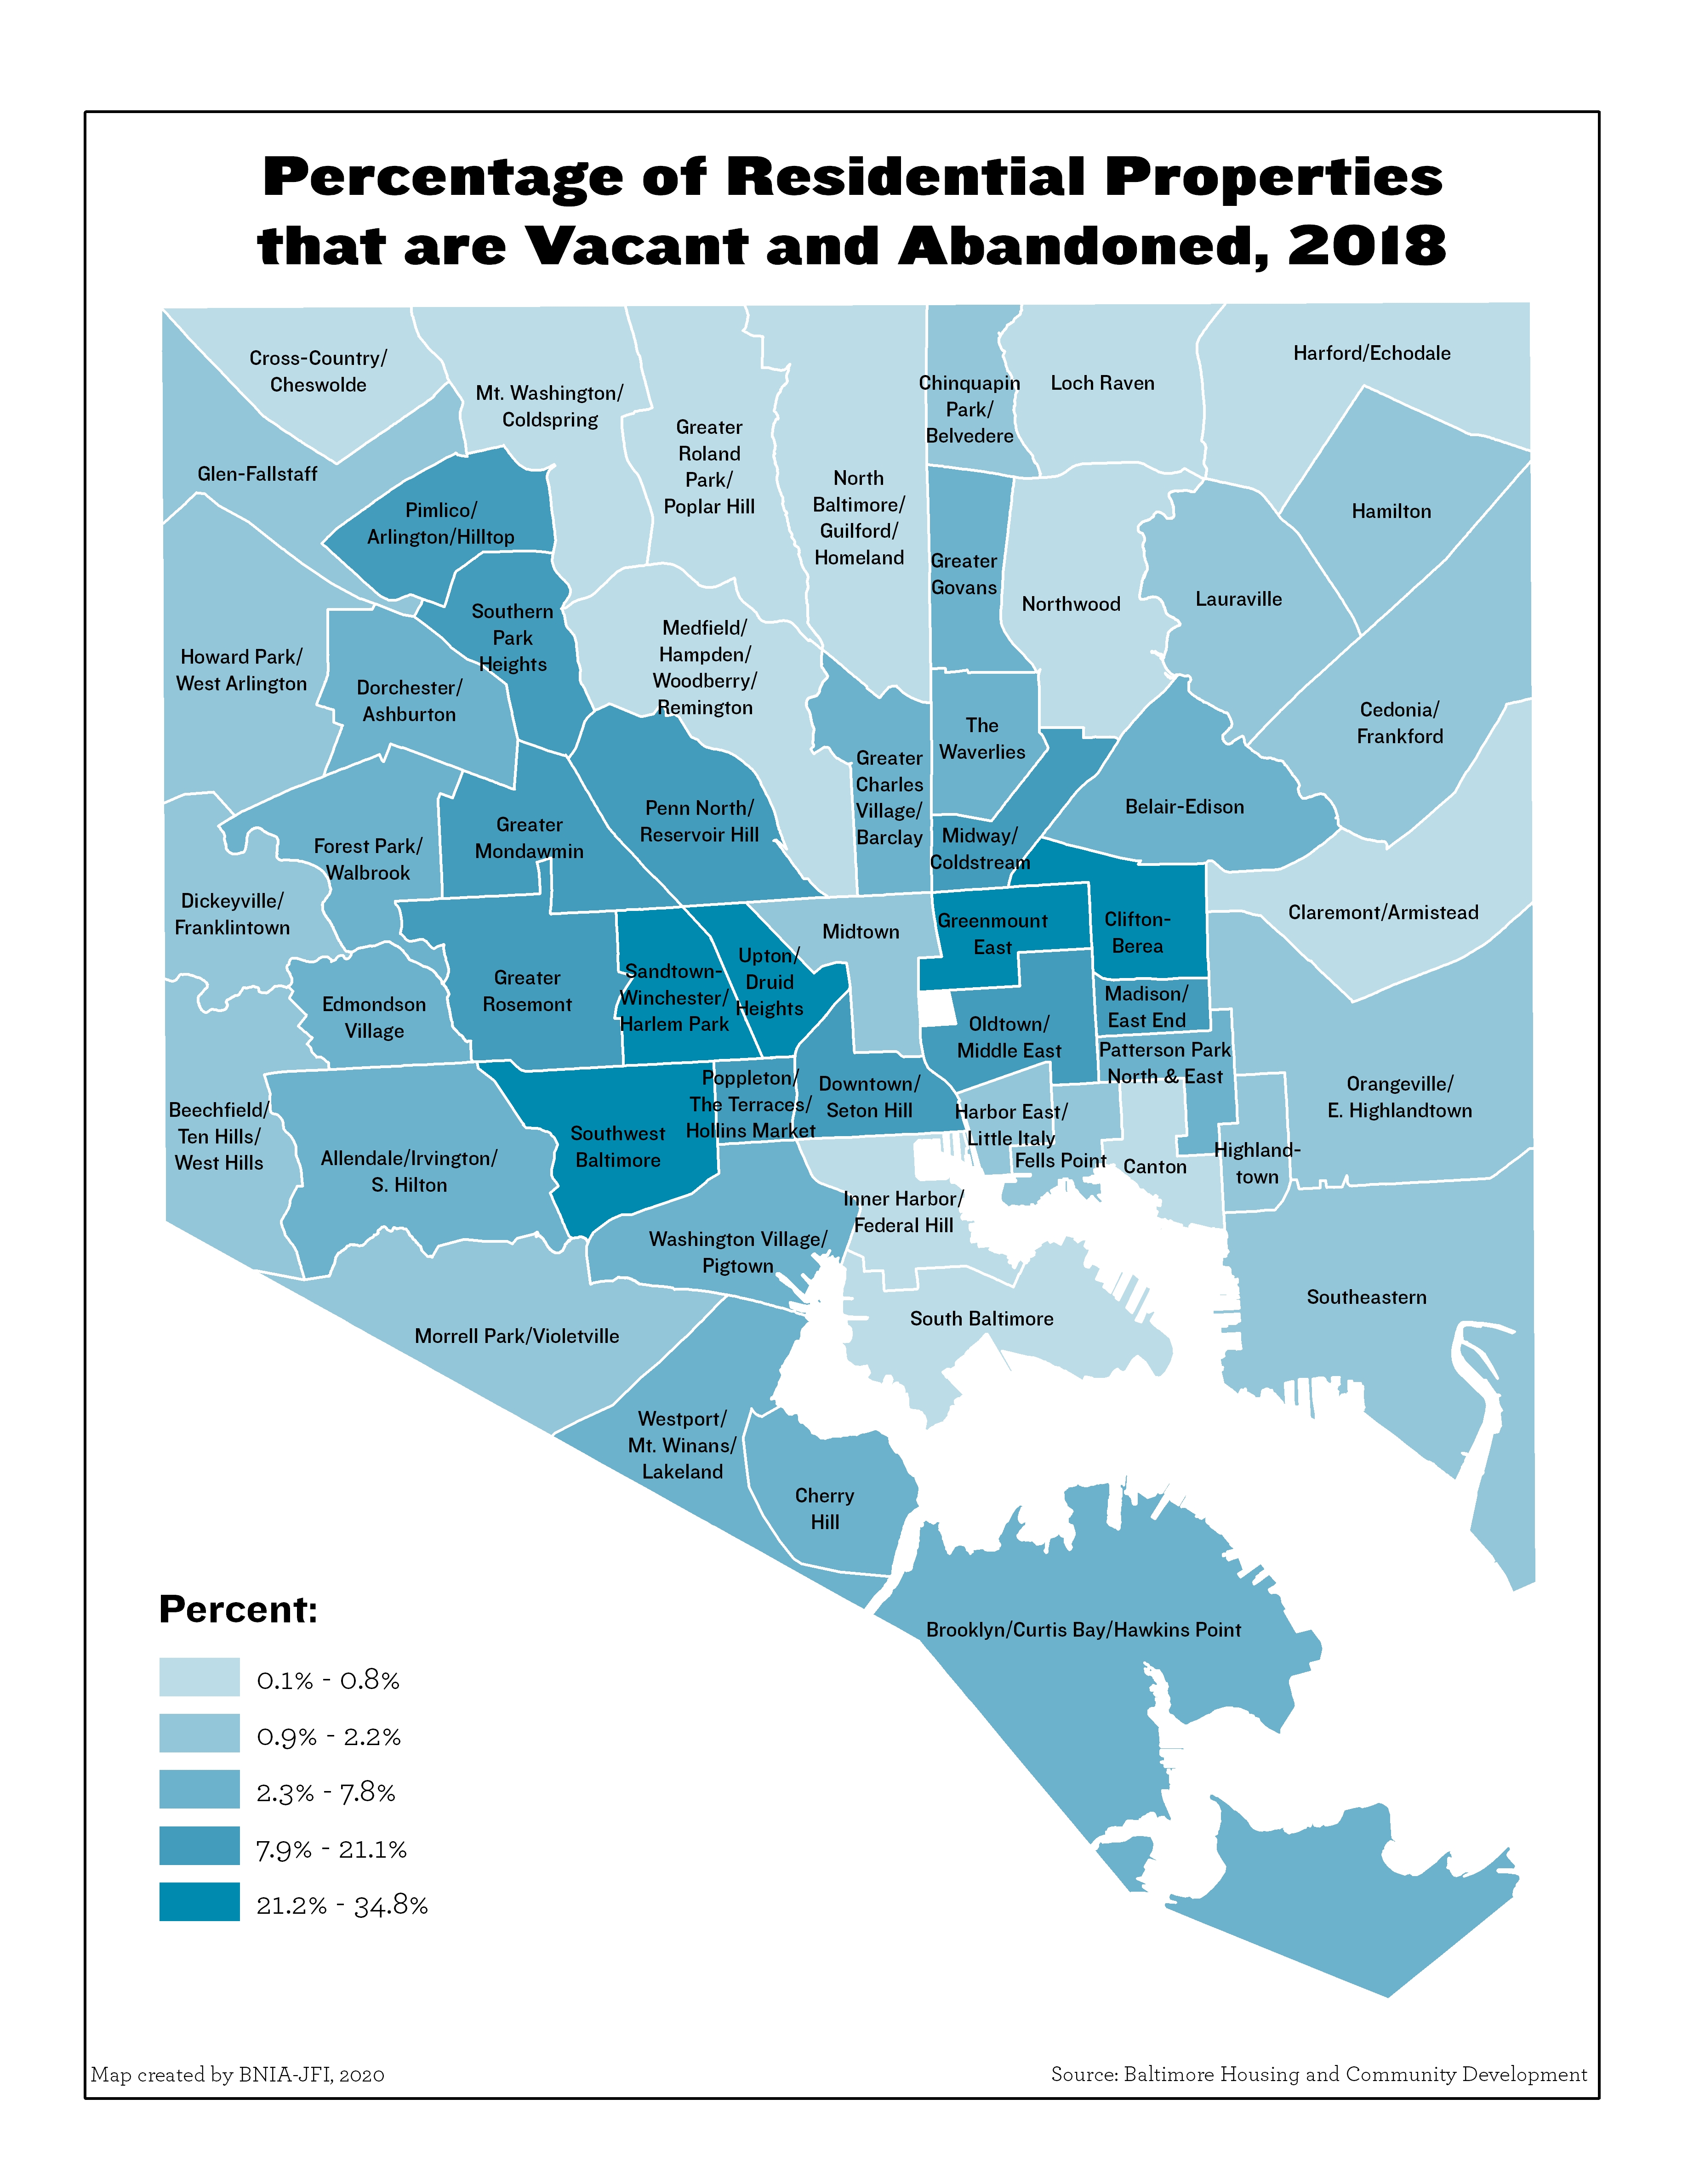
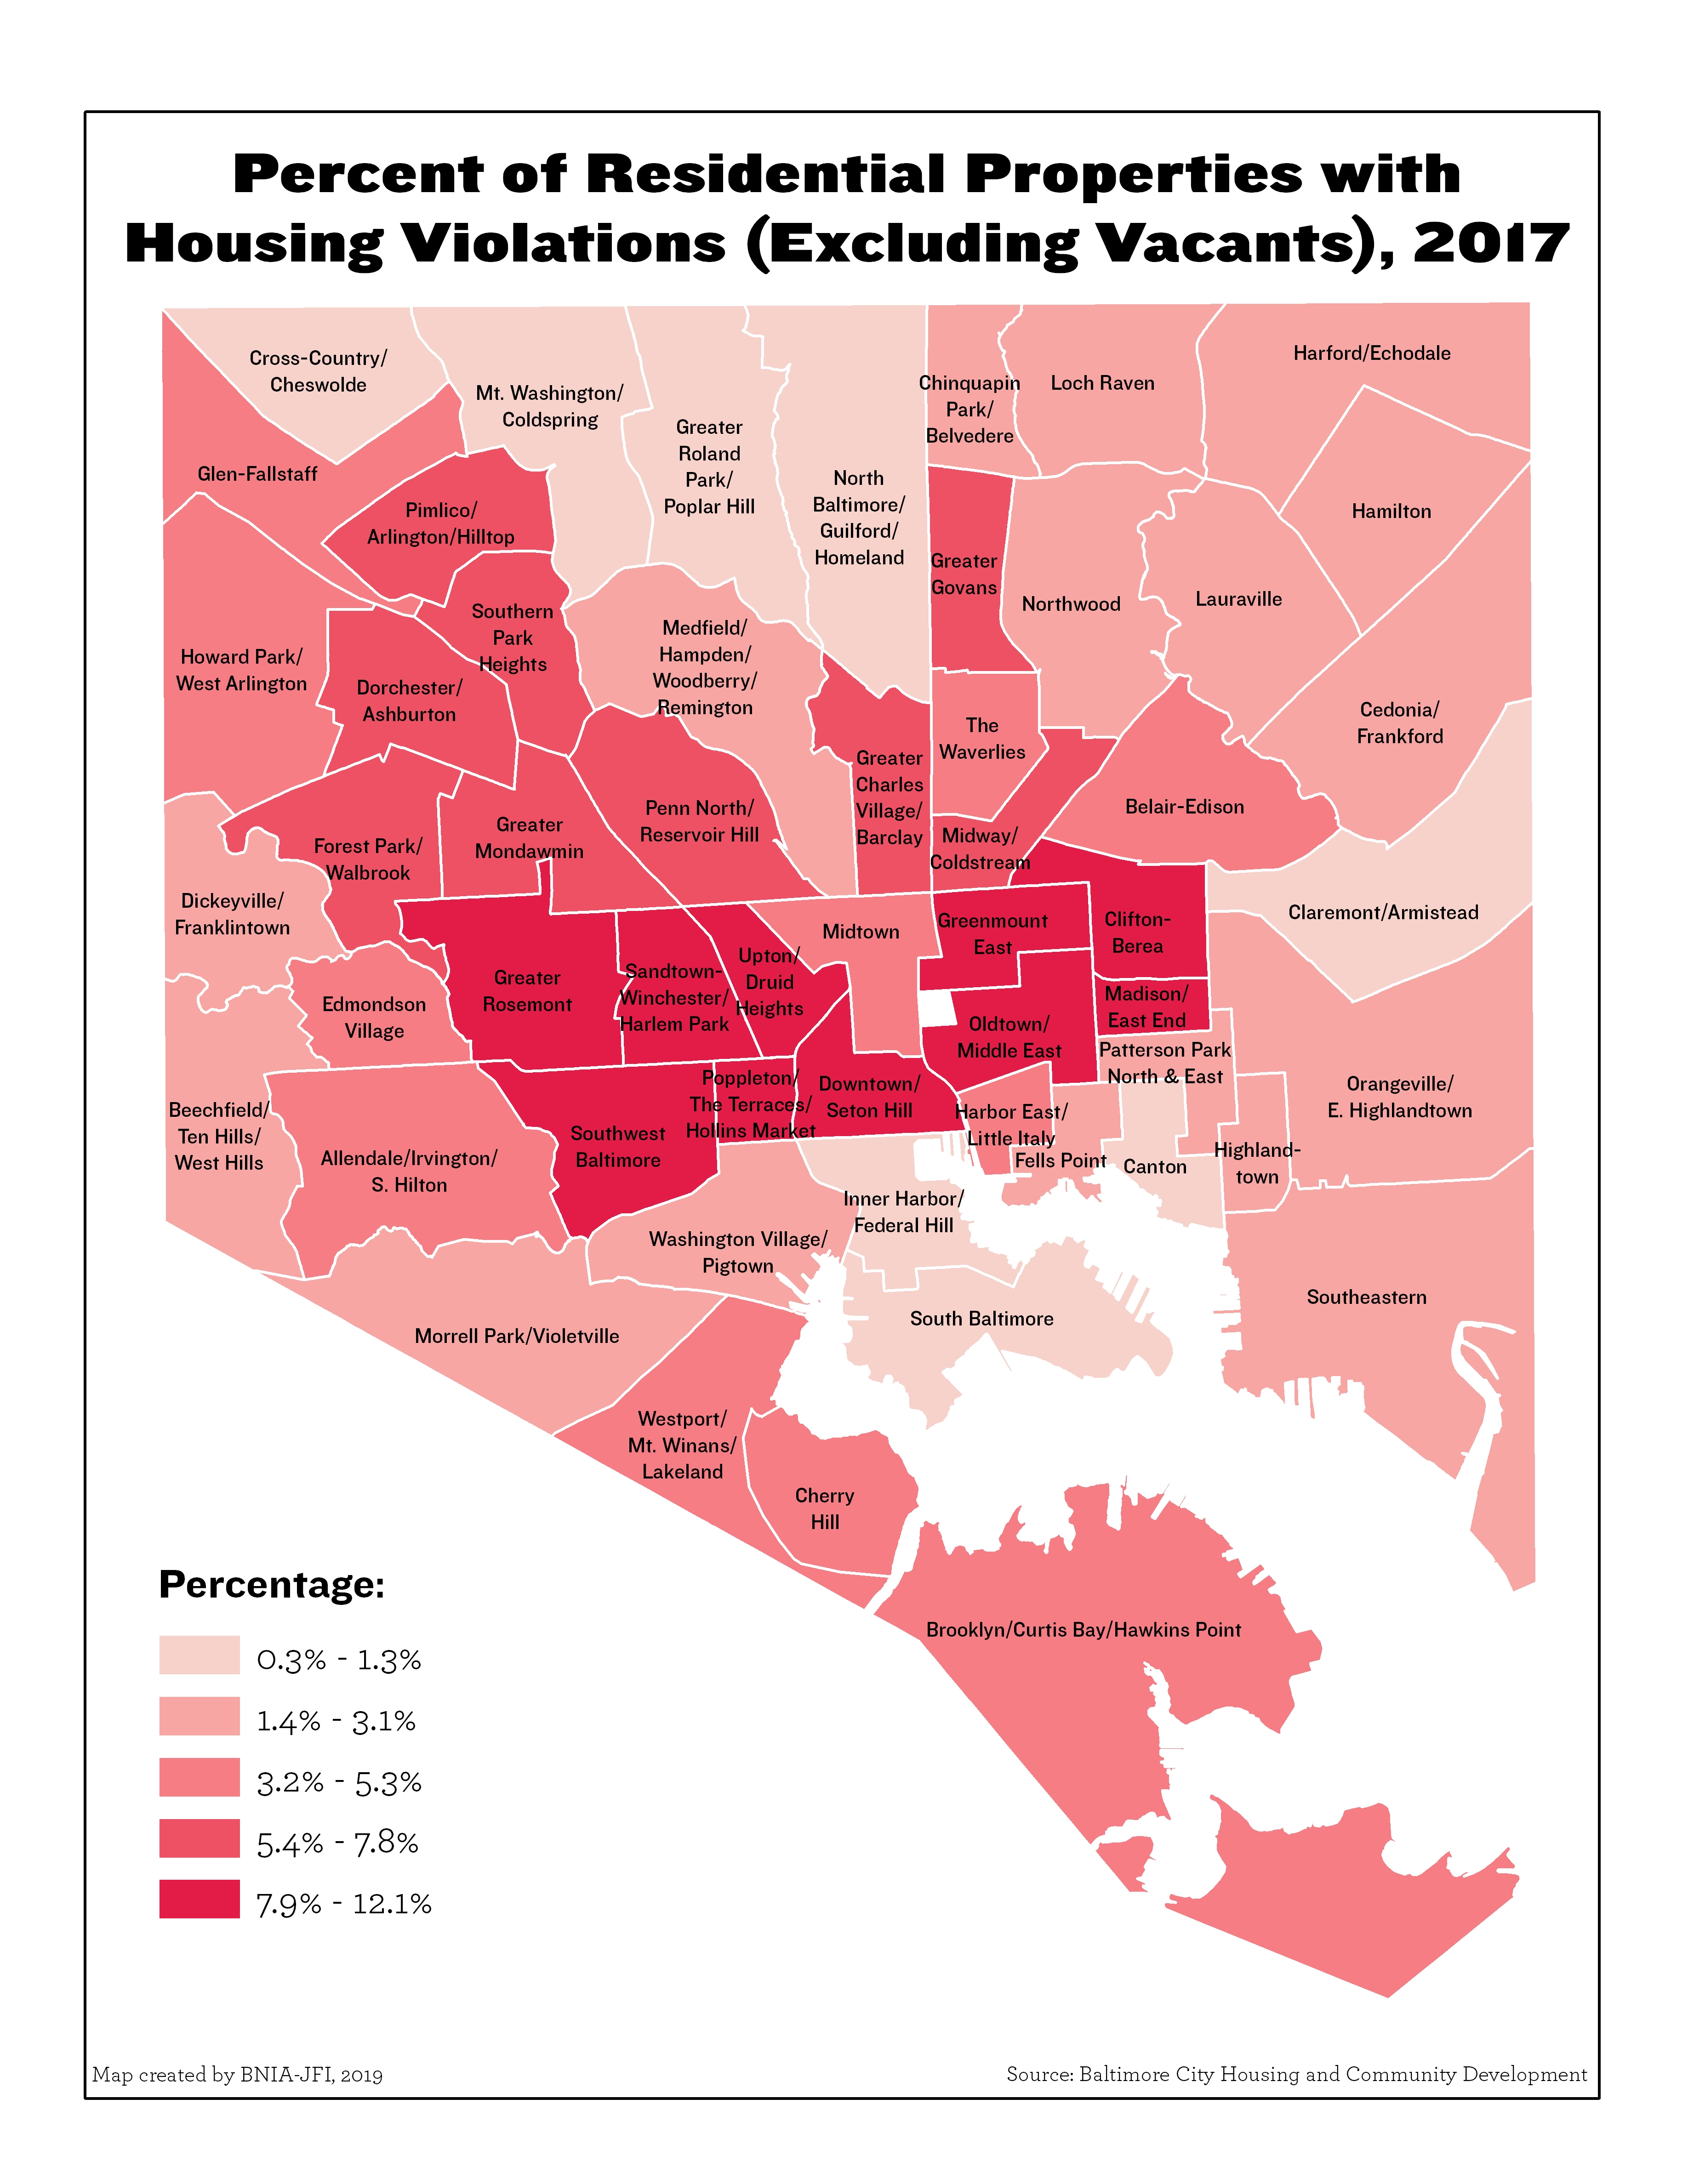
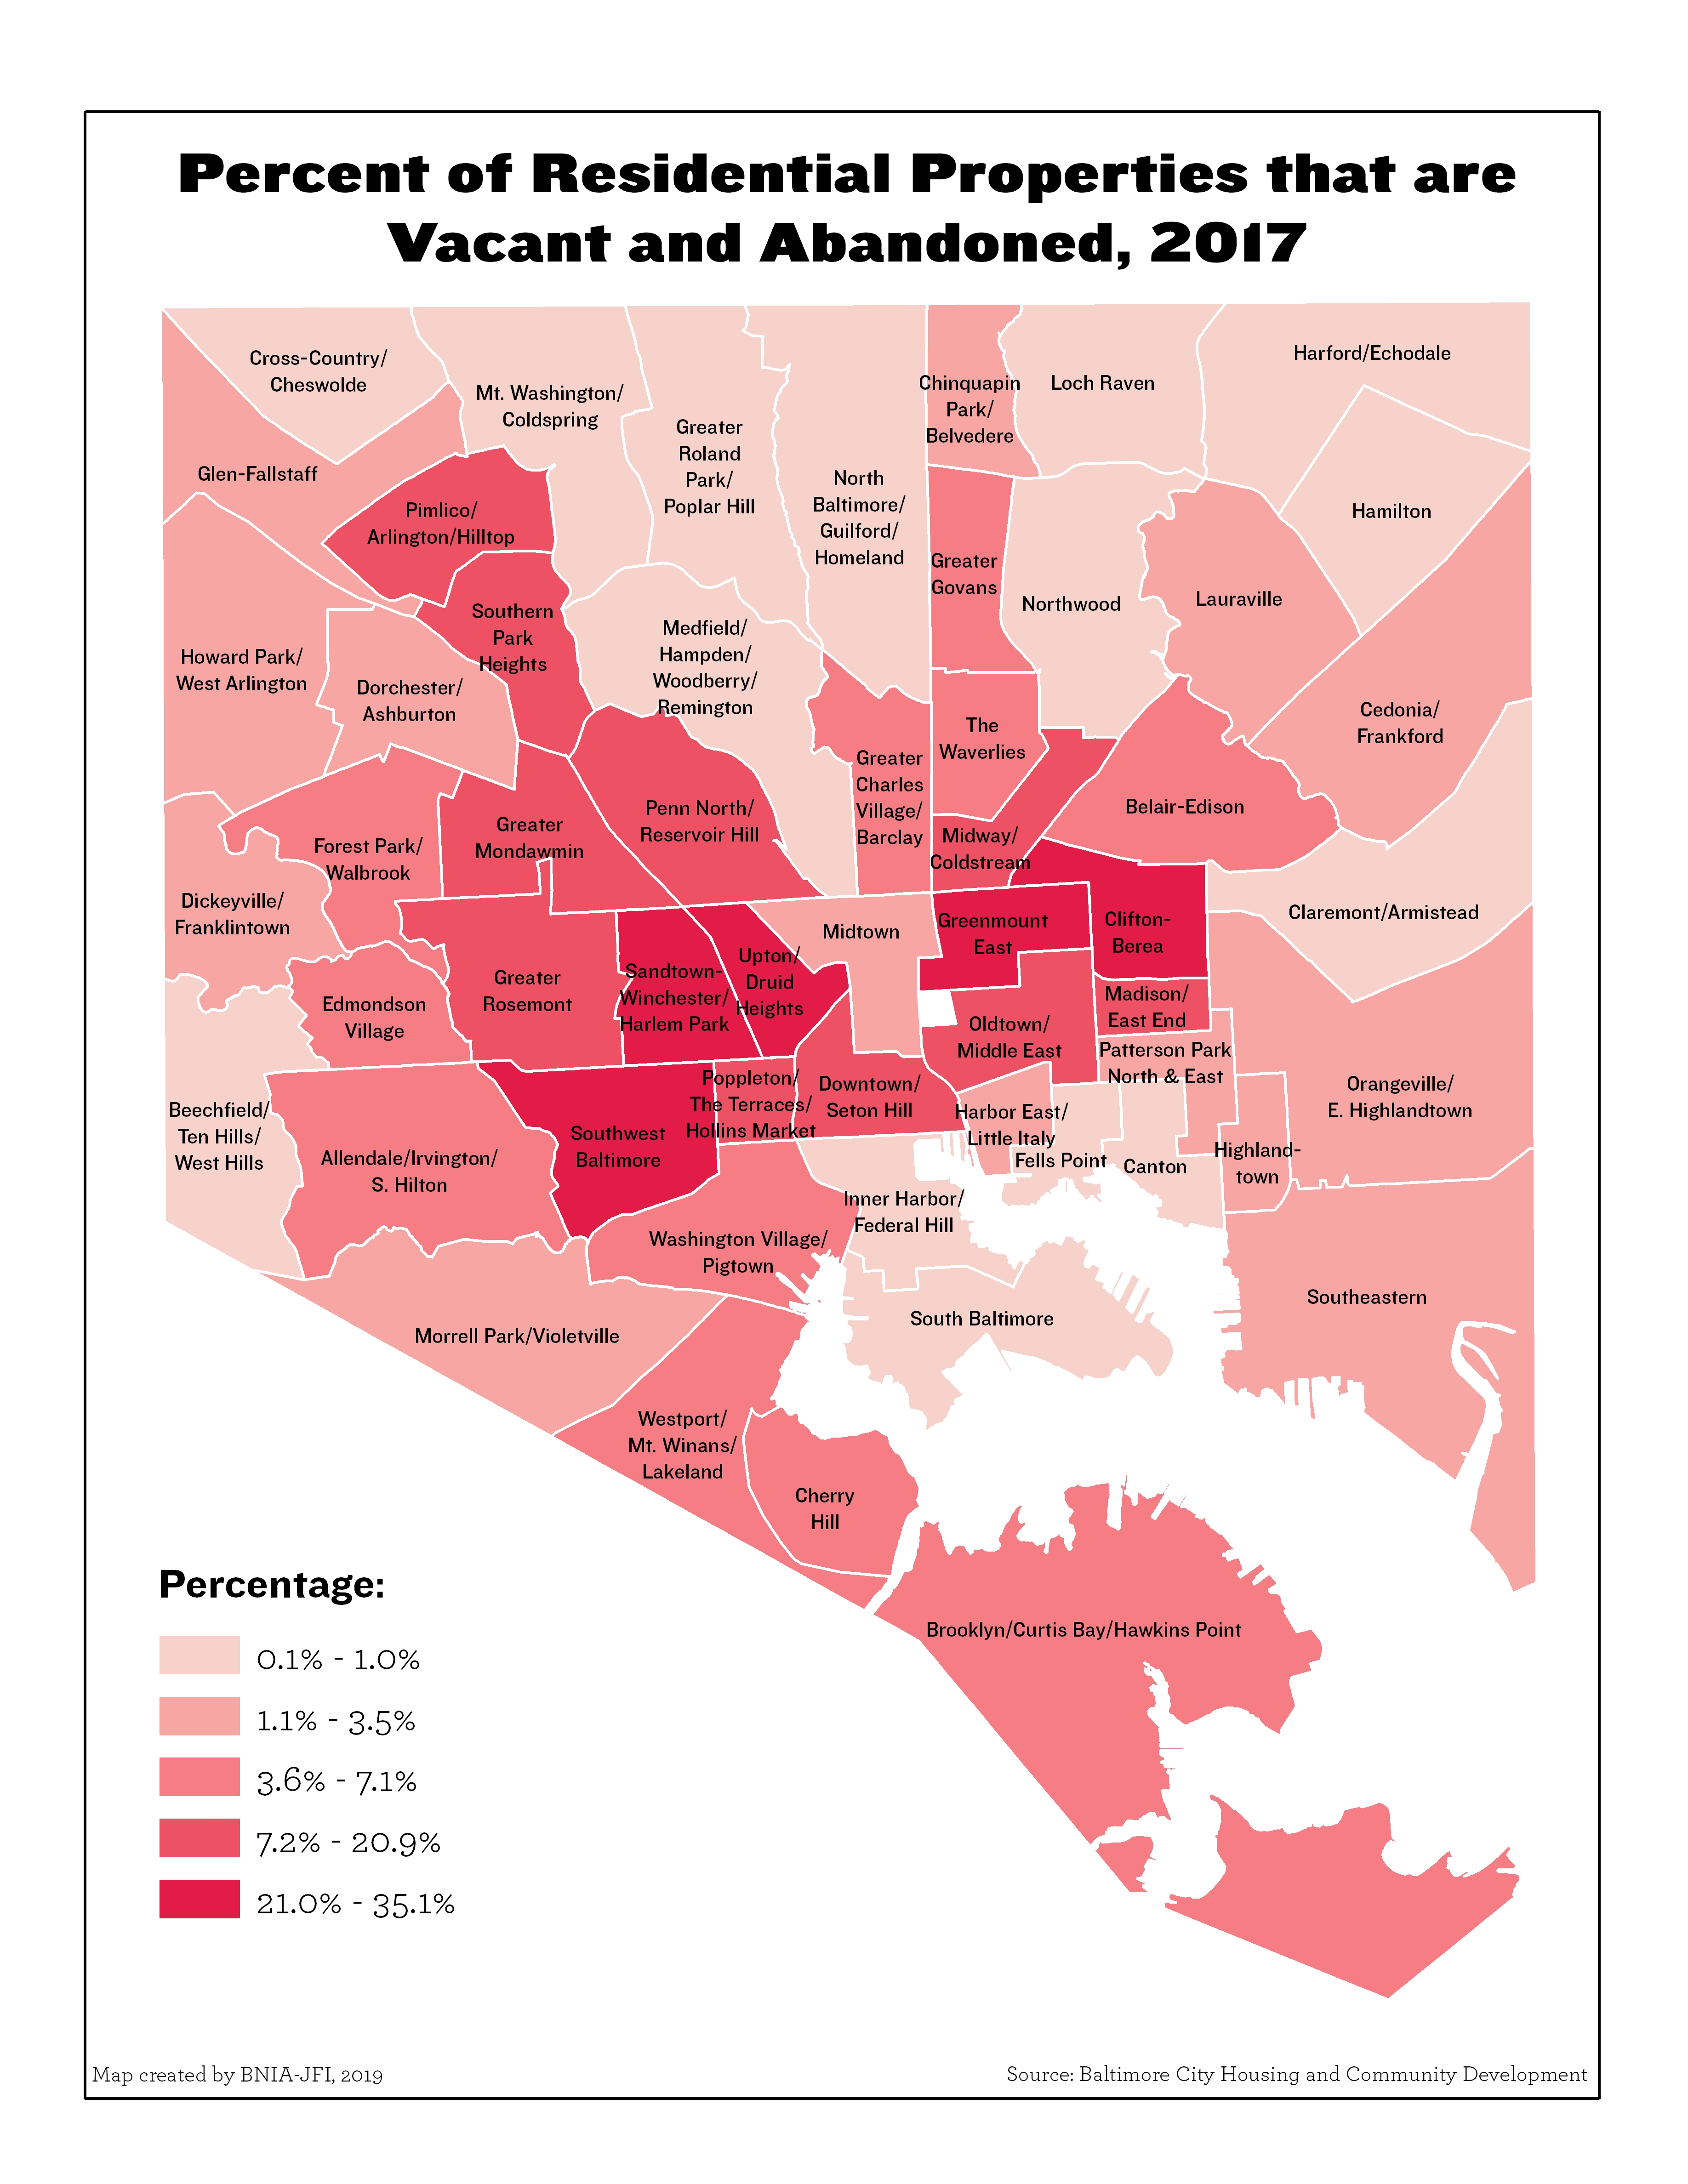
Percentage of Residential Properties that are Vacant and Abandoned (2020)
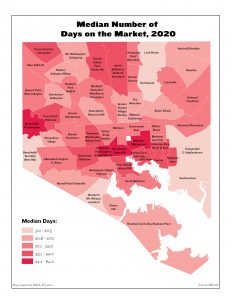
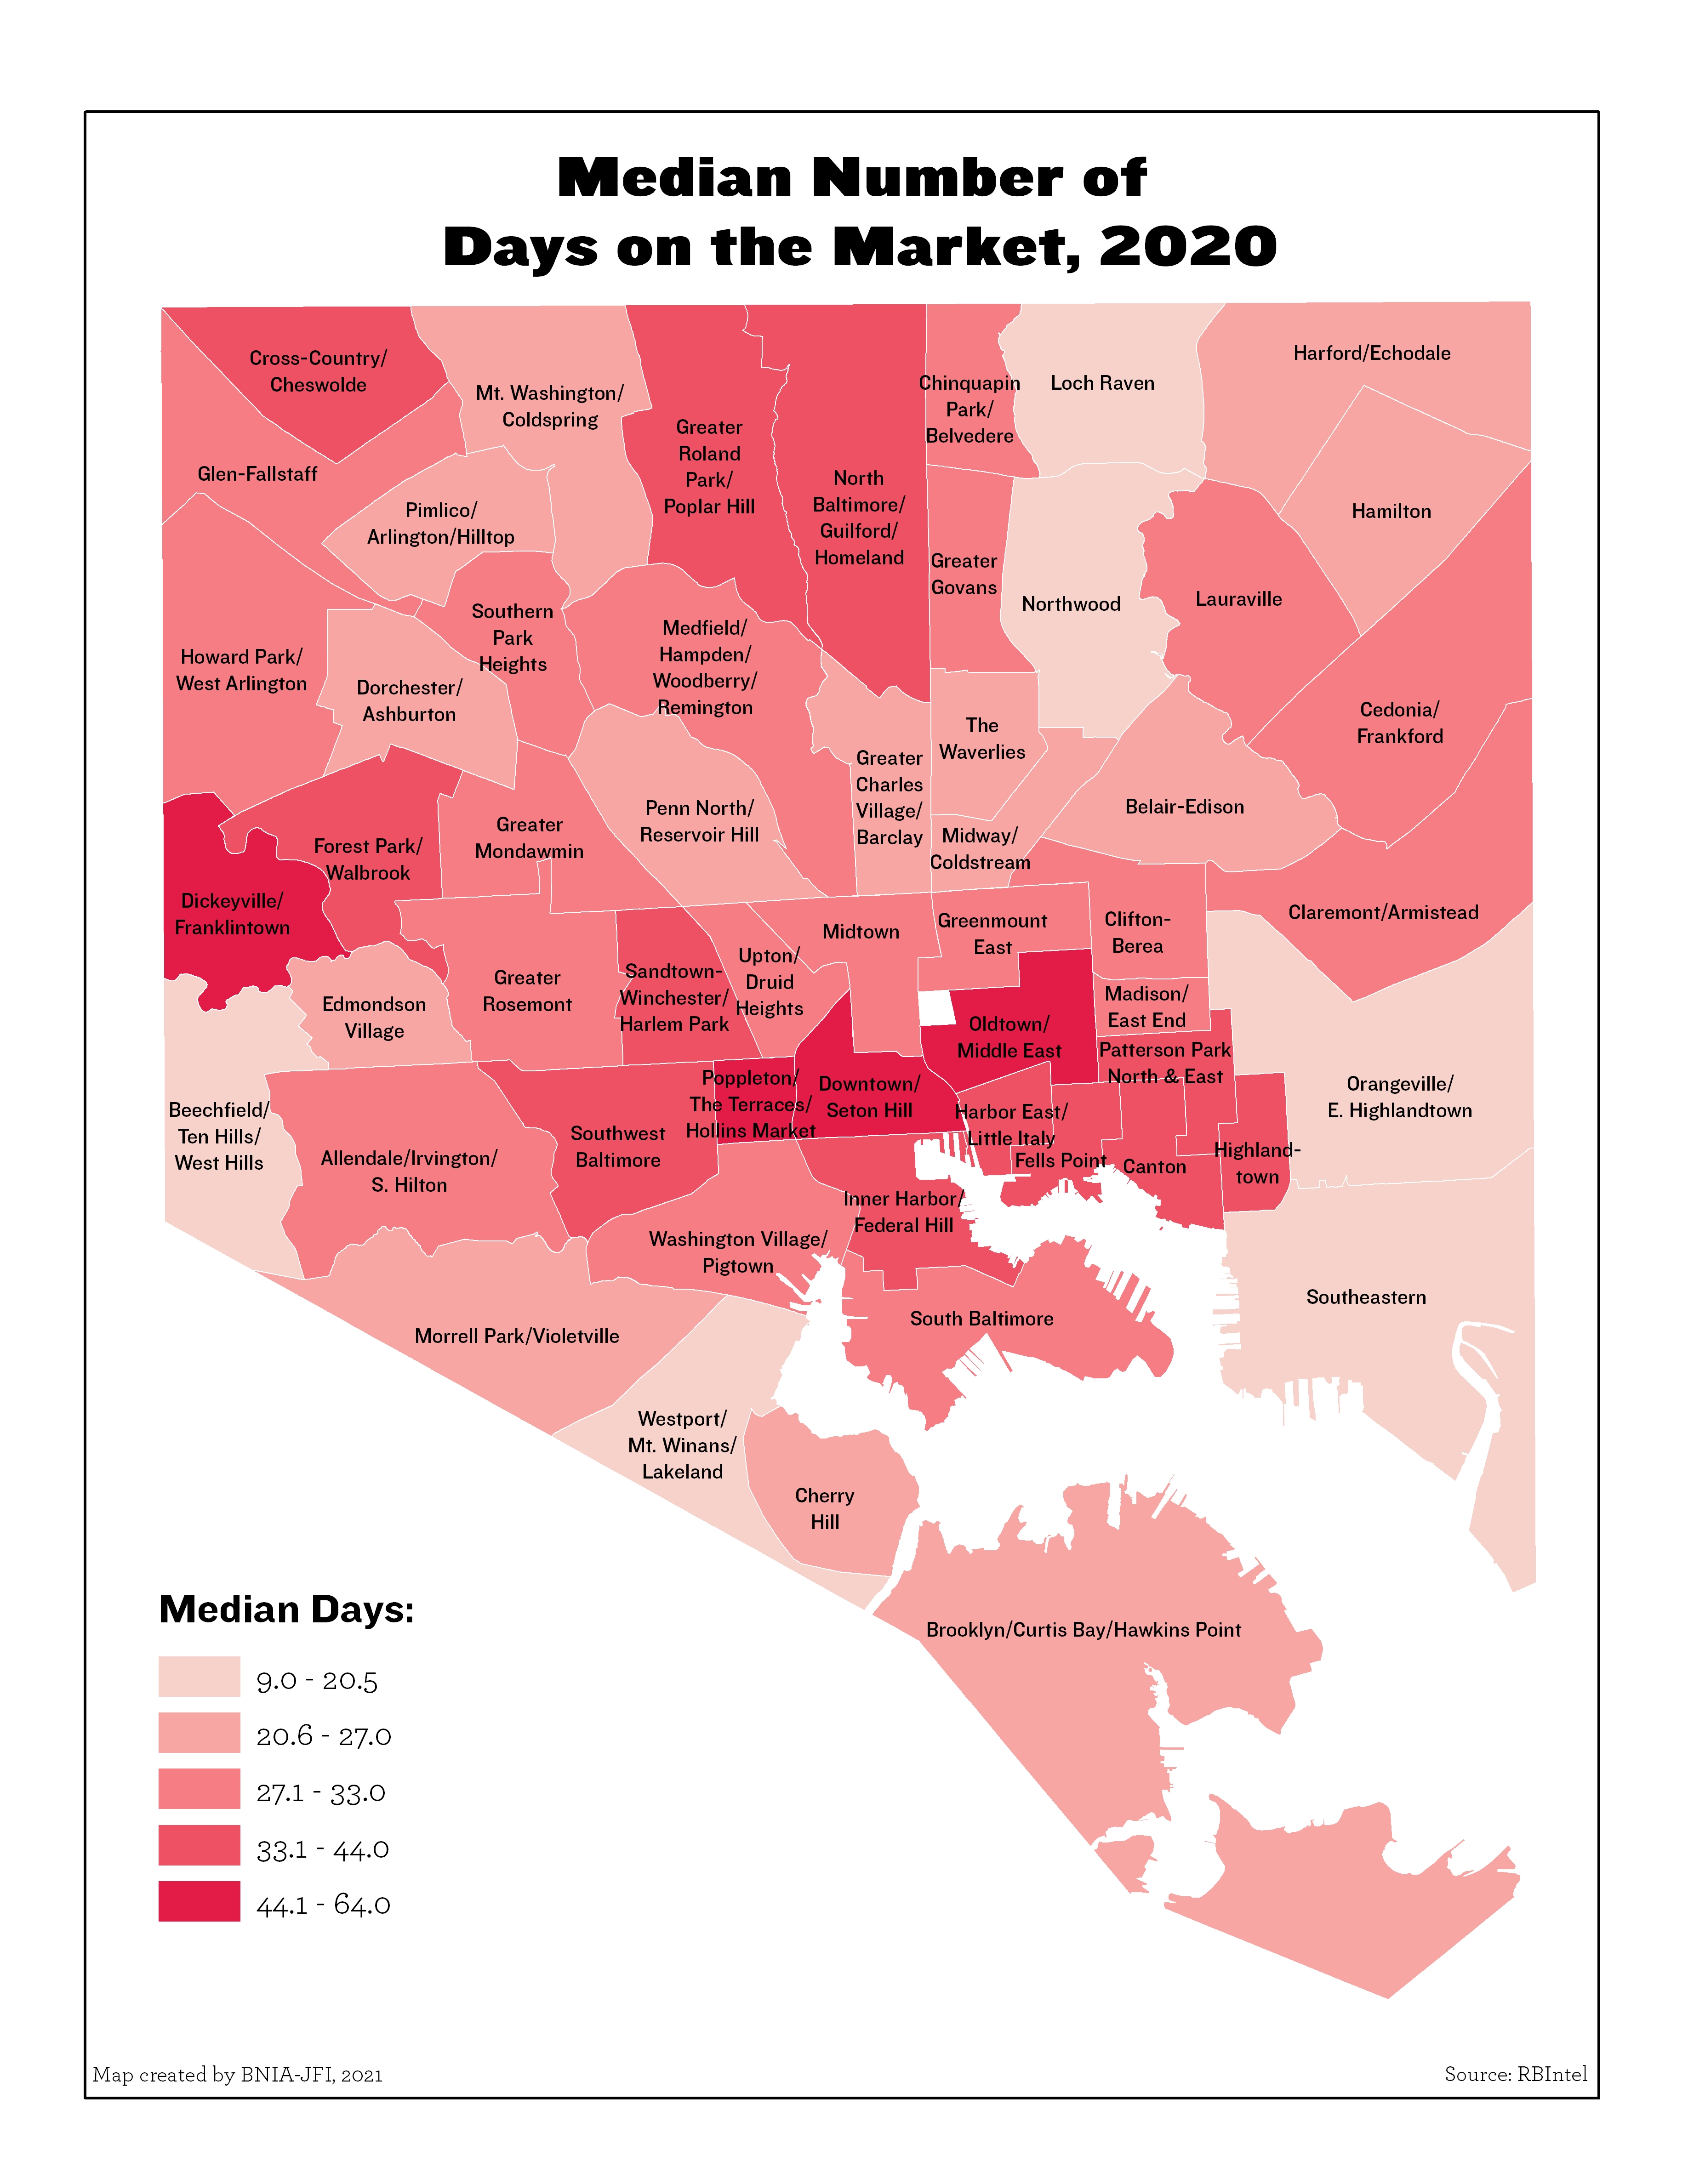
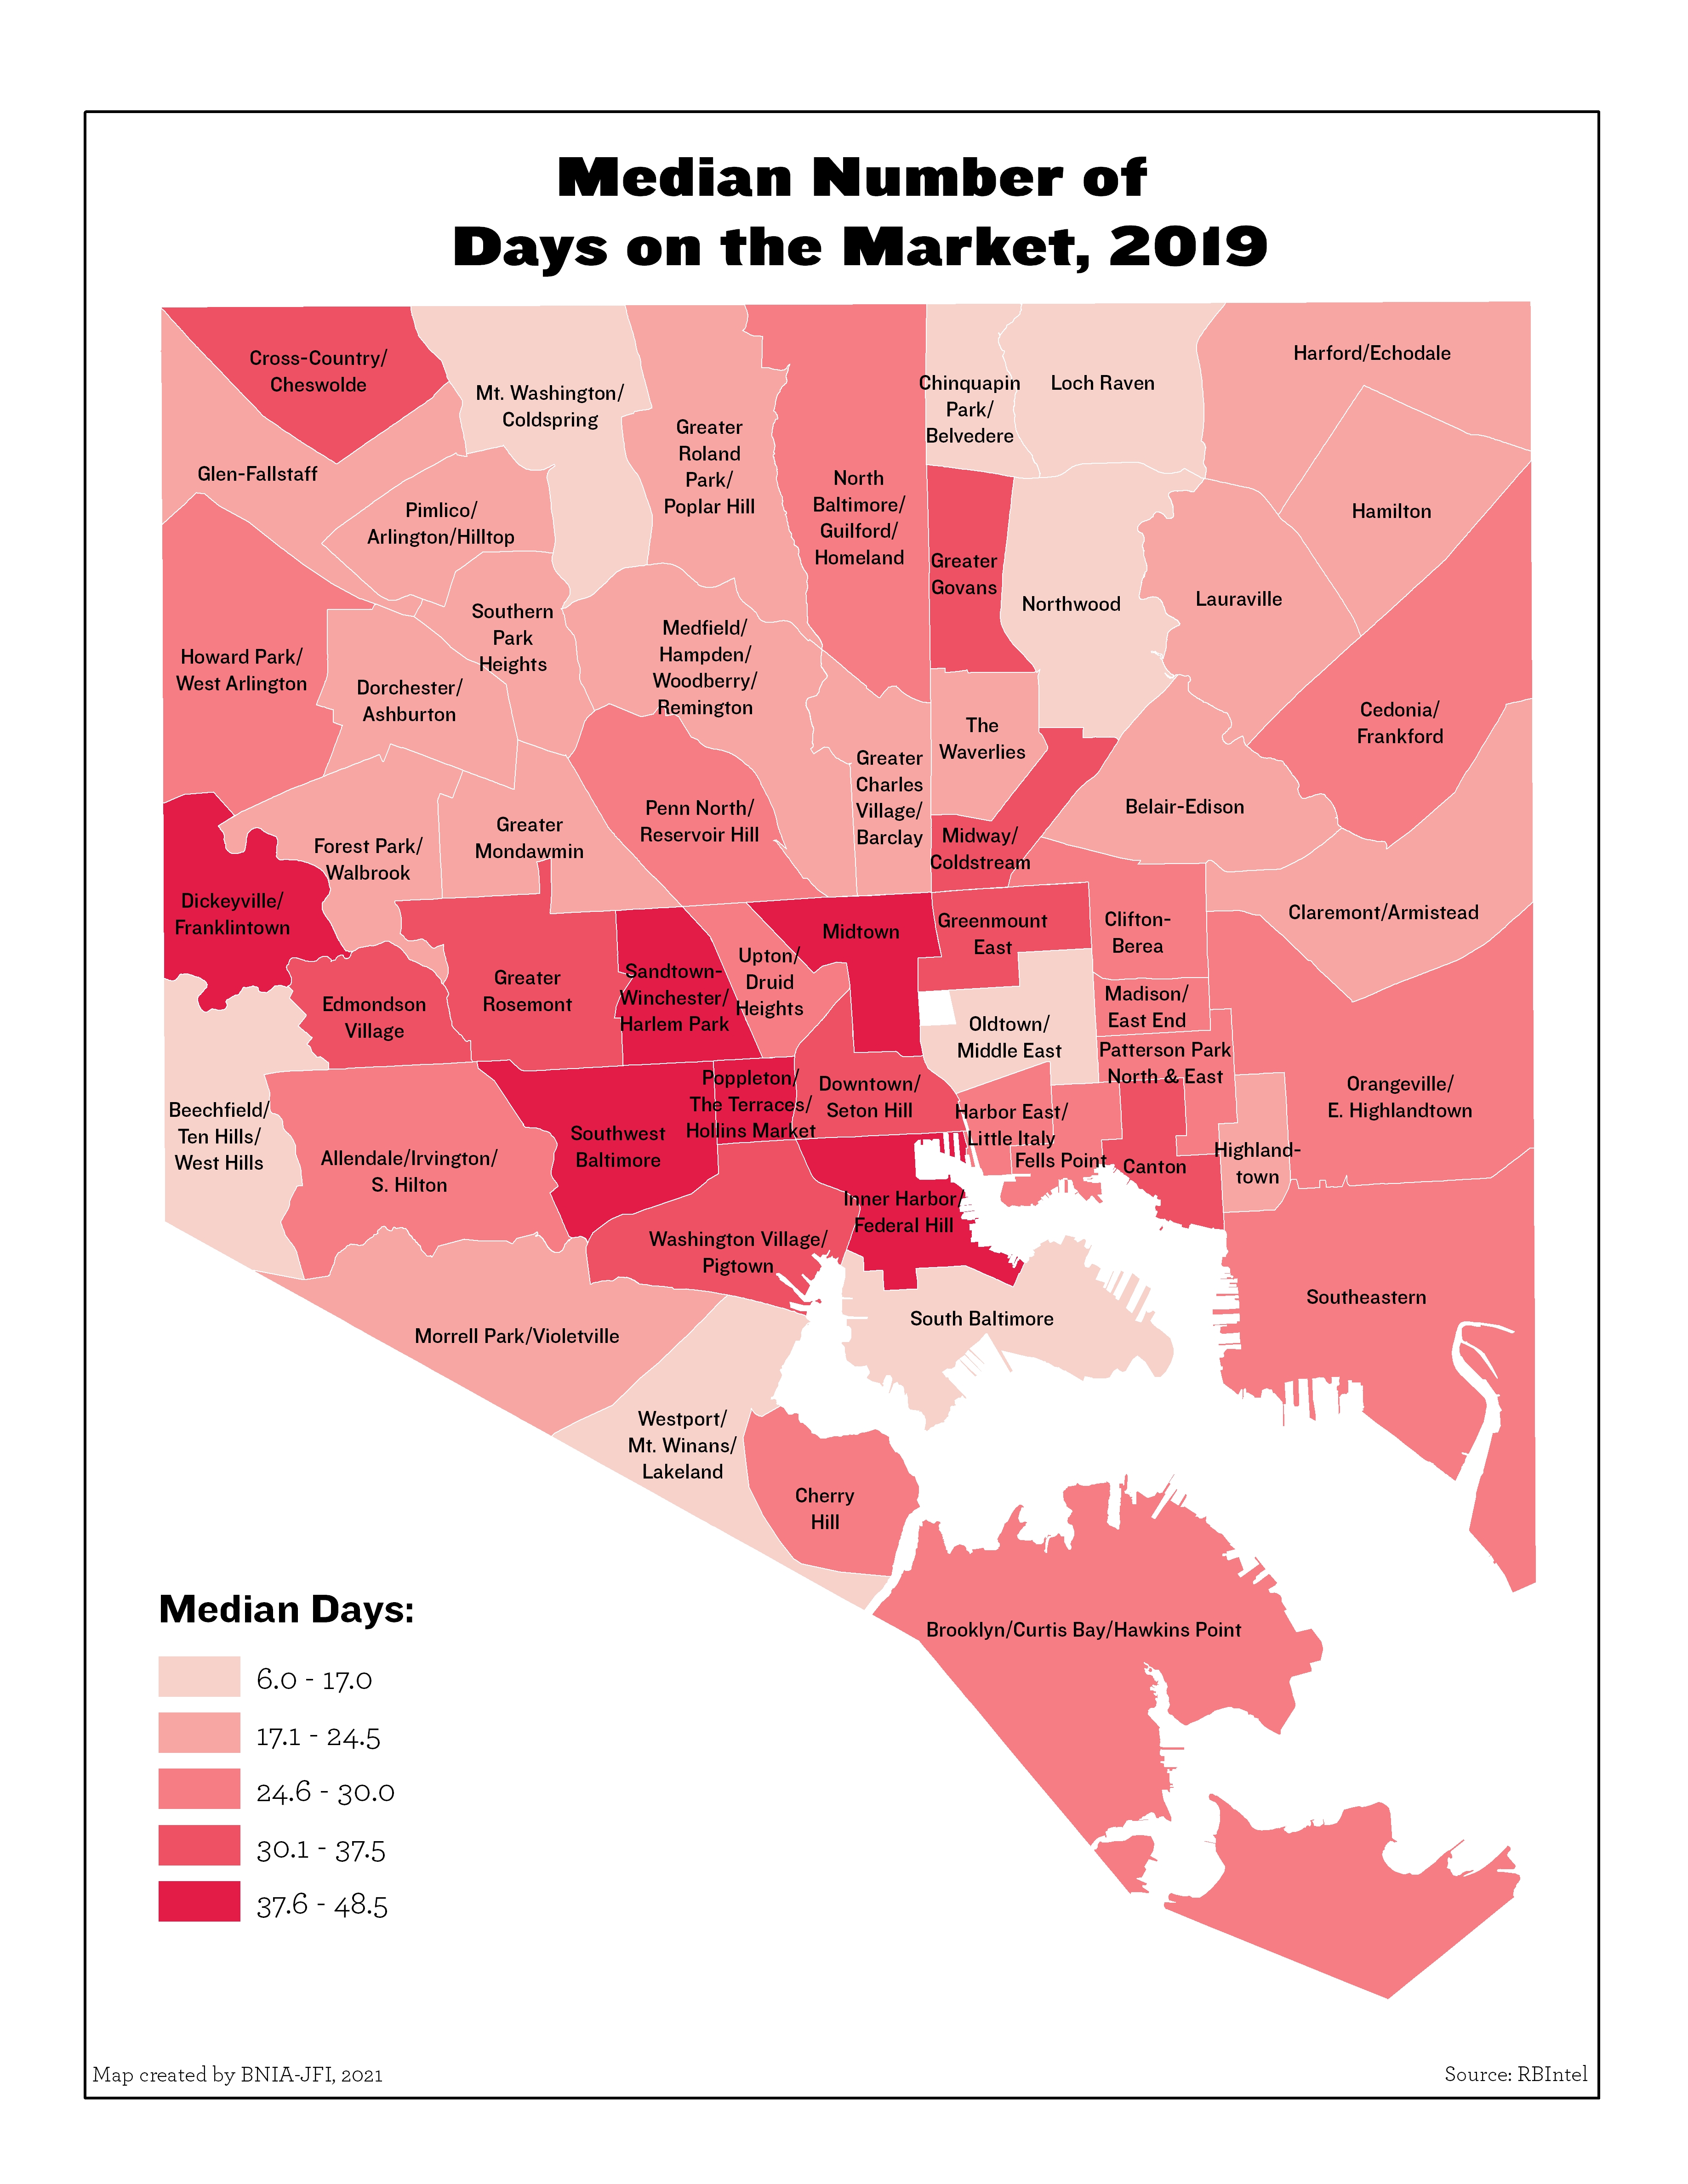
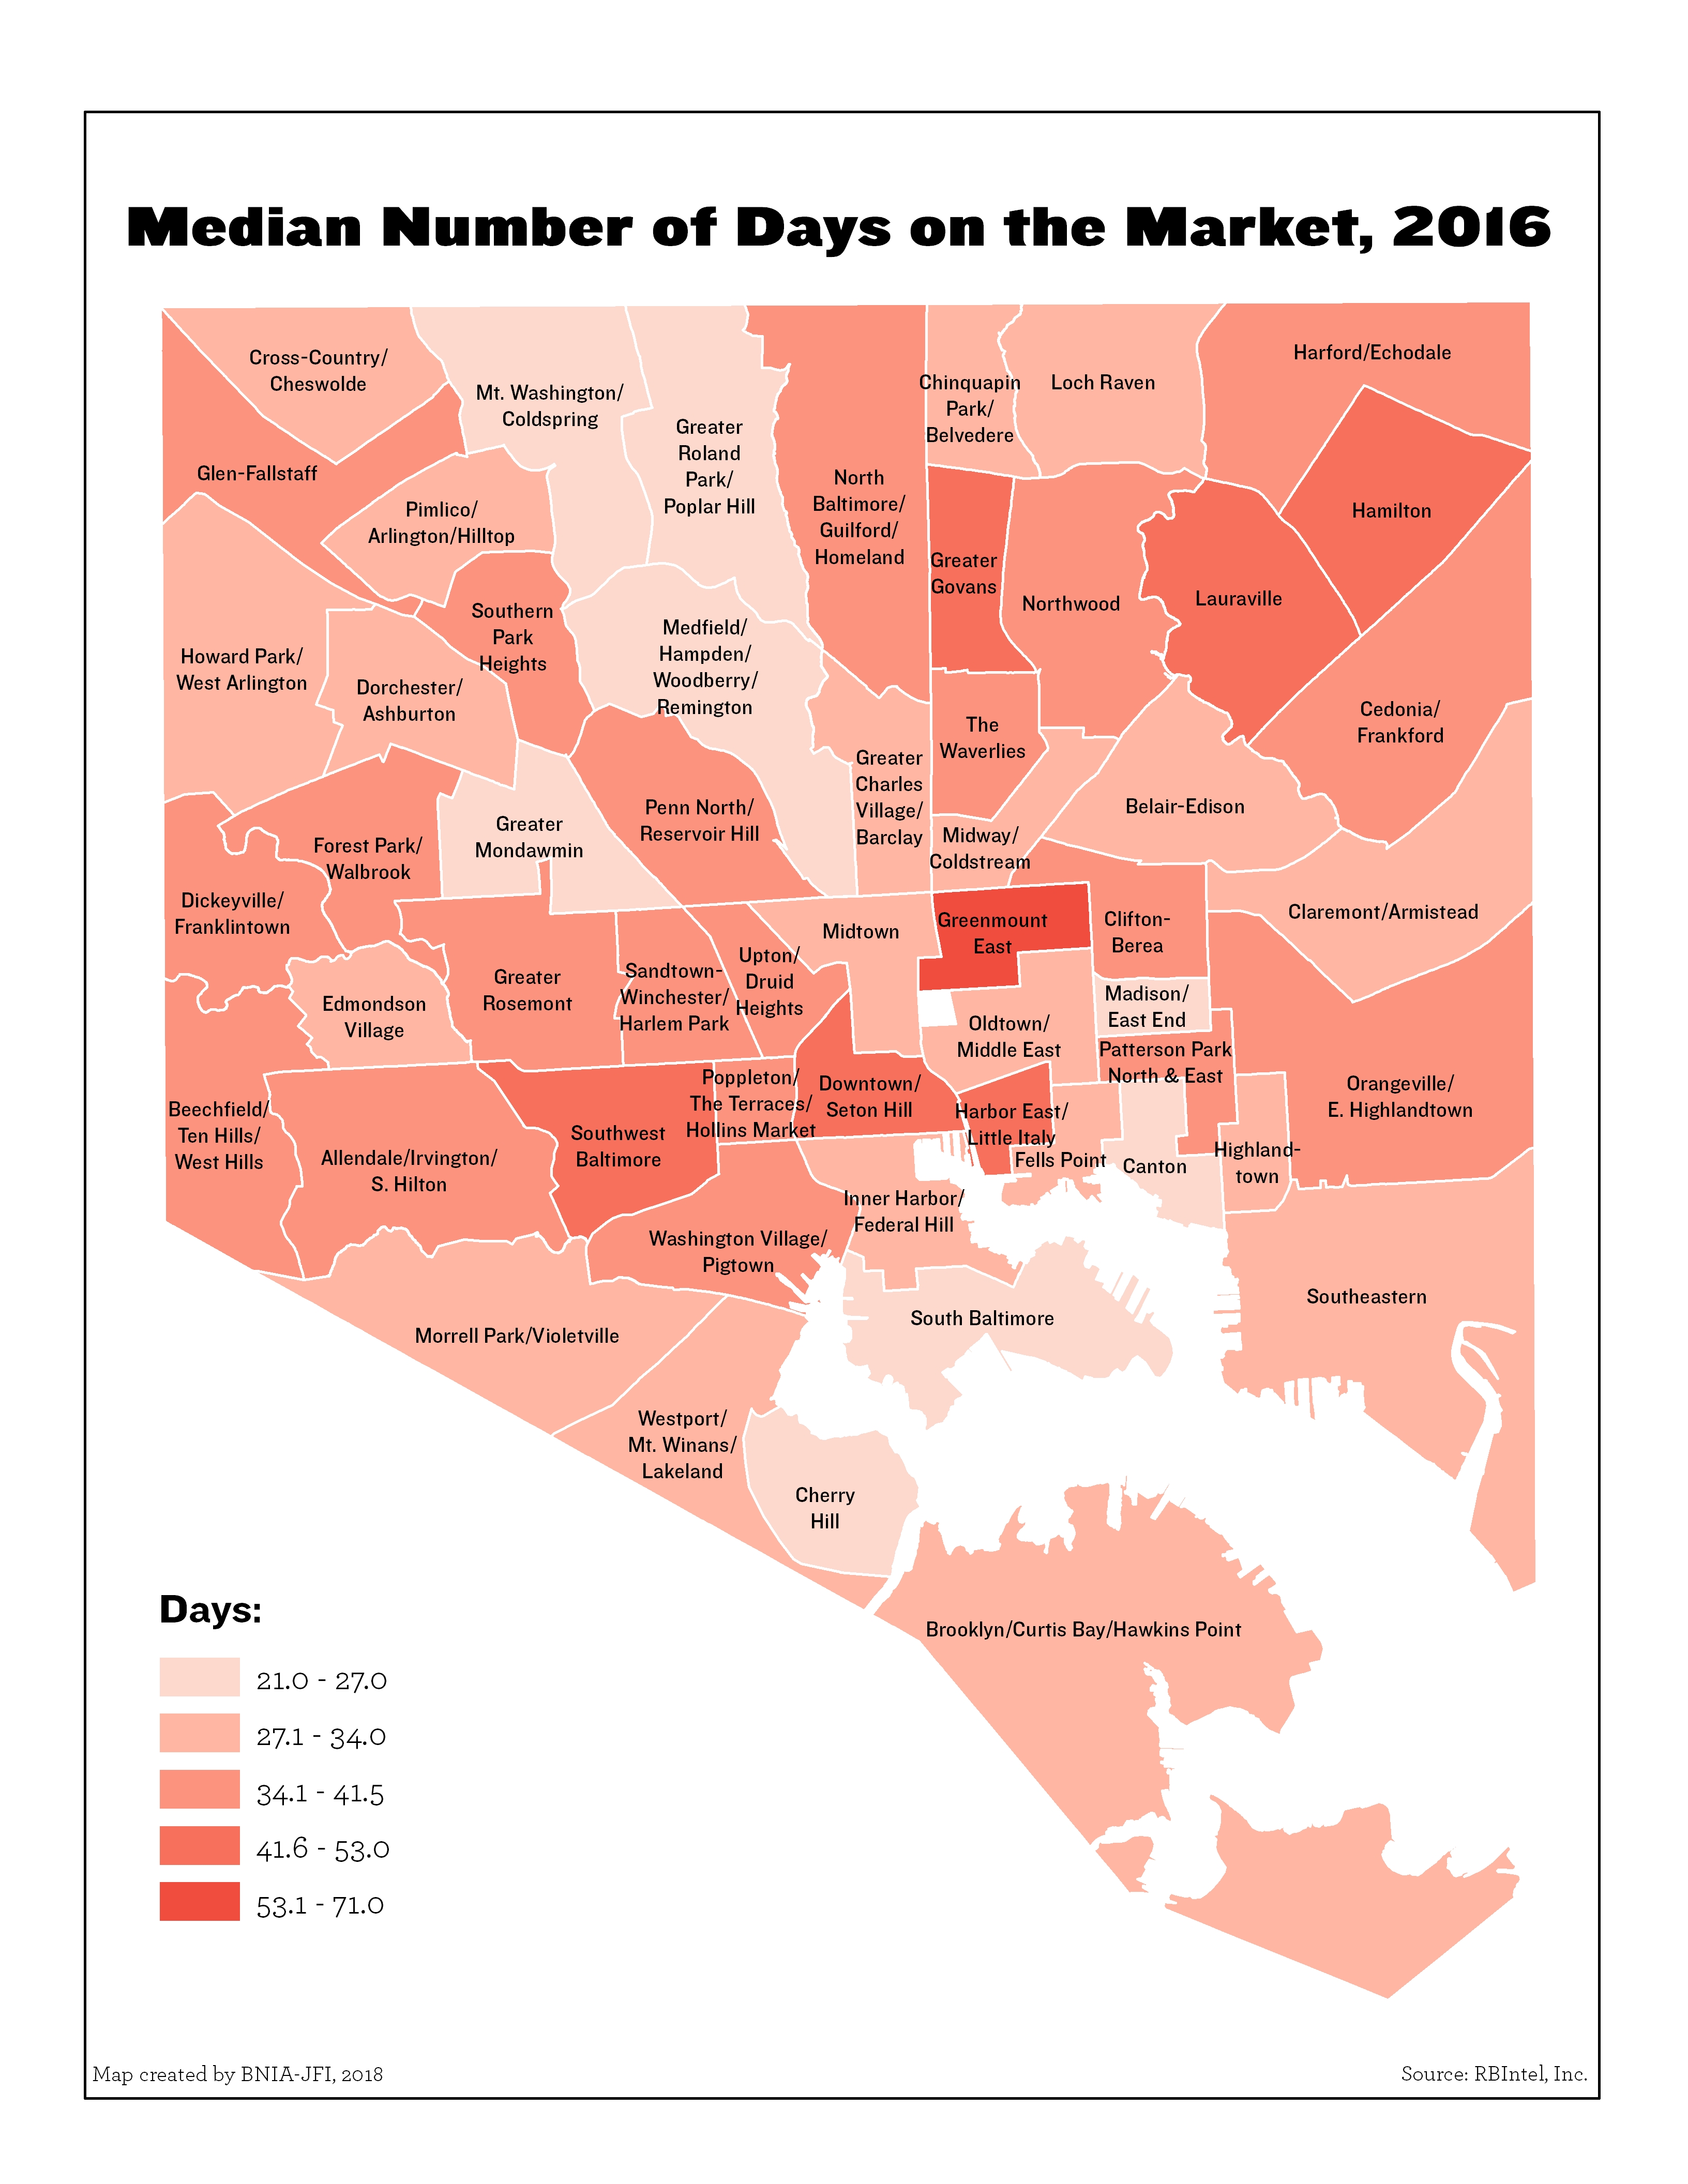
Median Number of Days on the Market (2020)
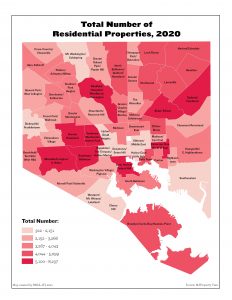
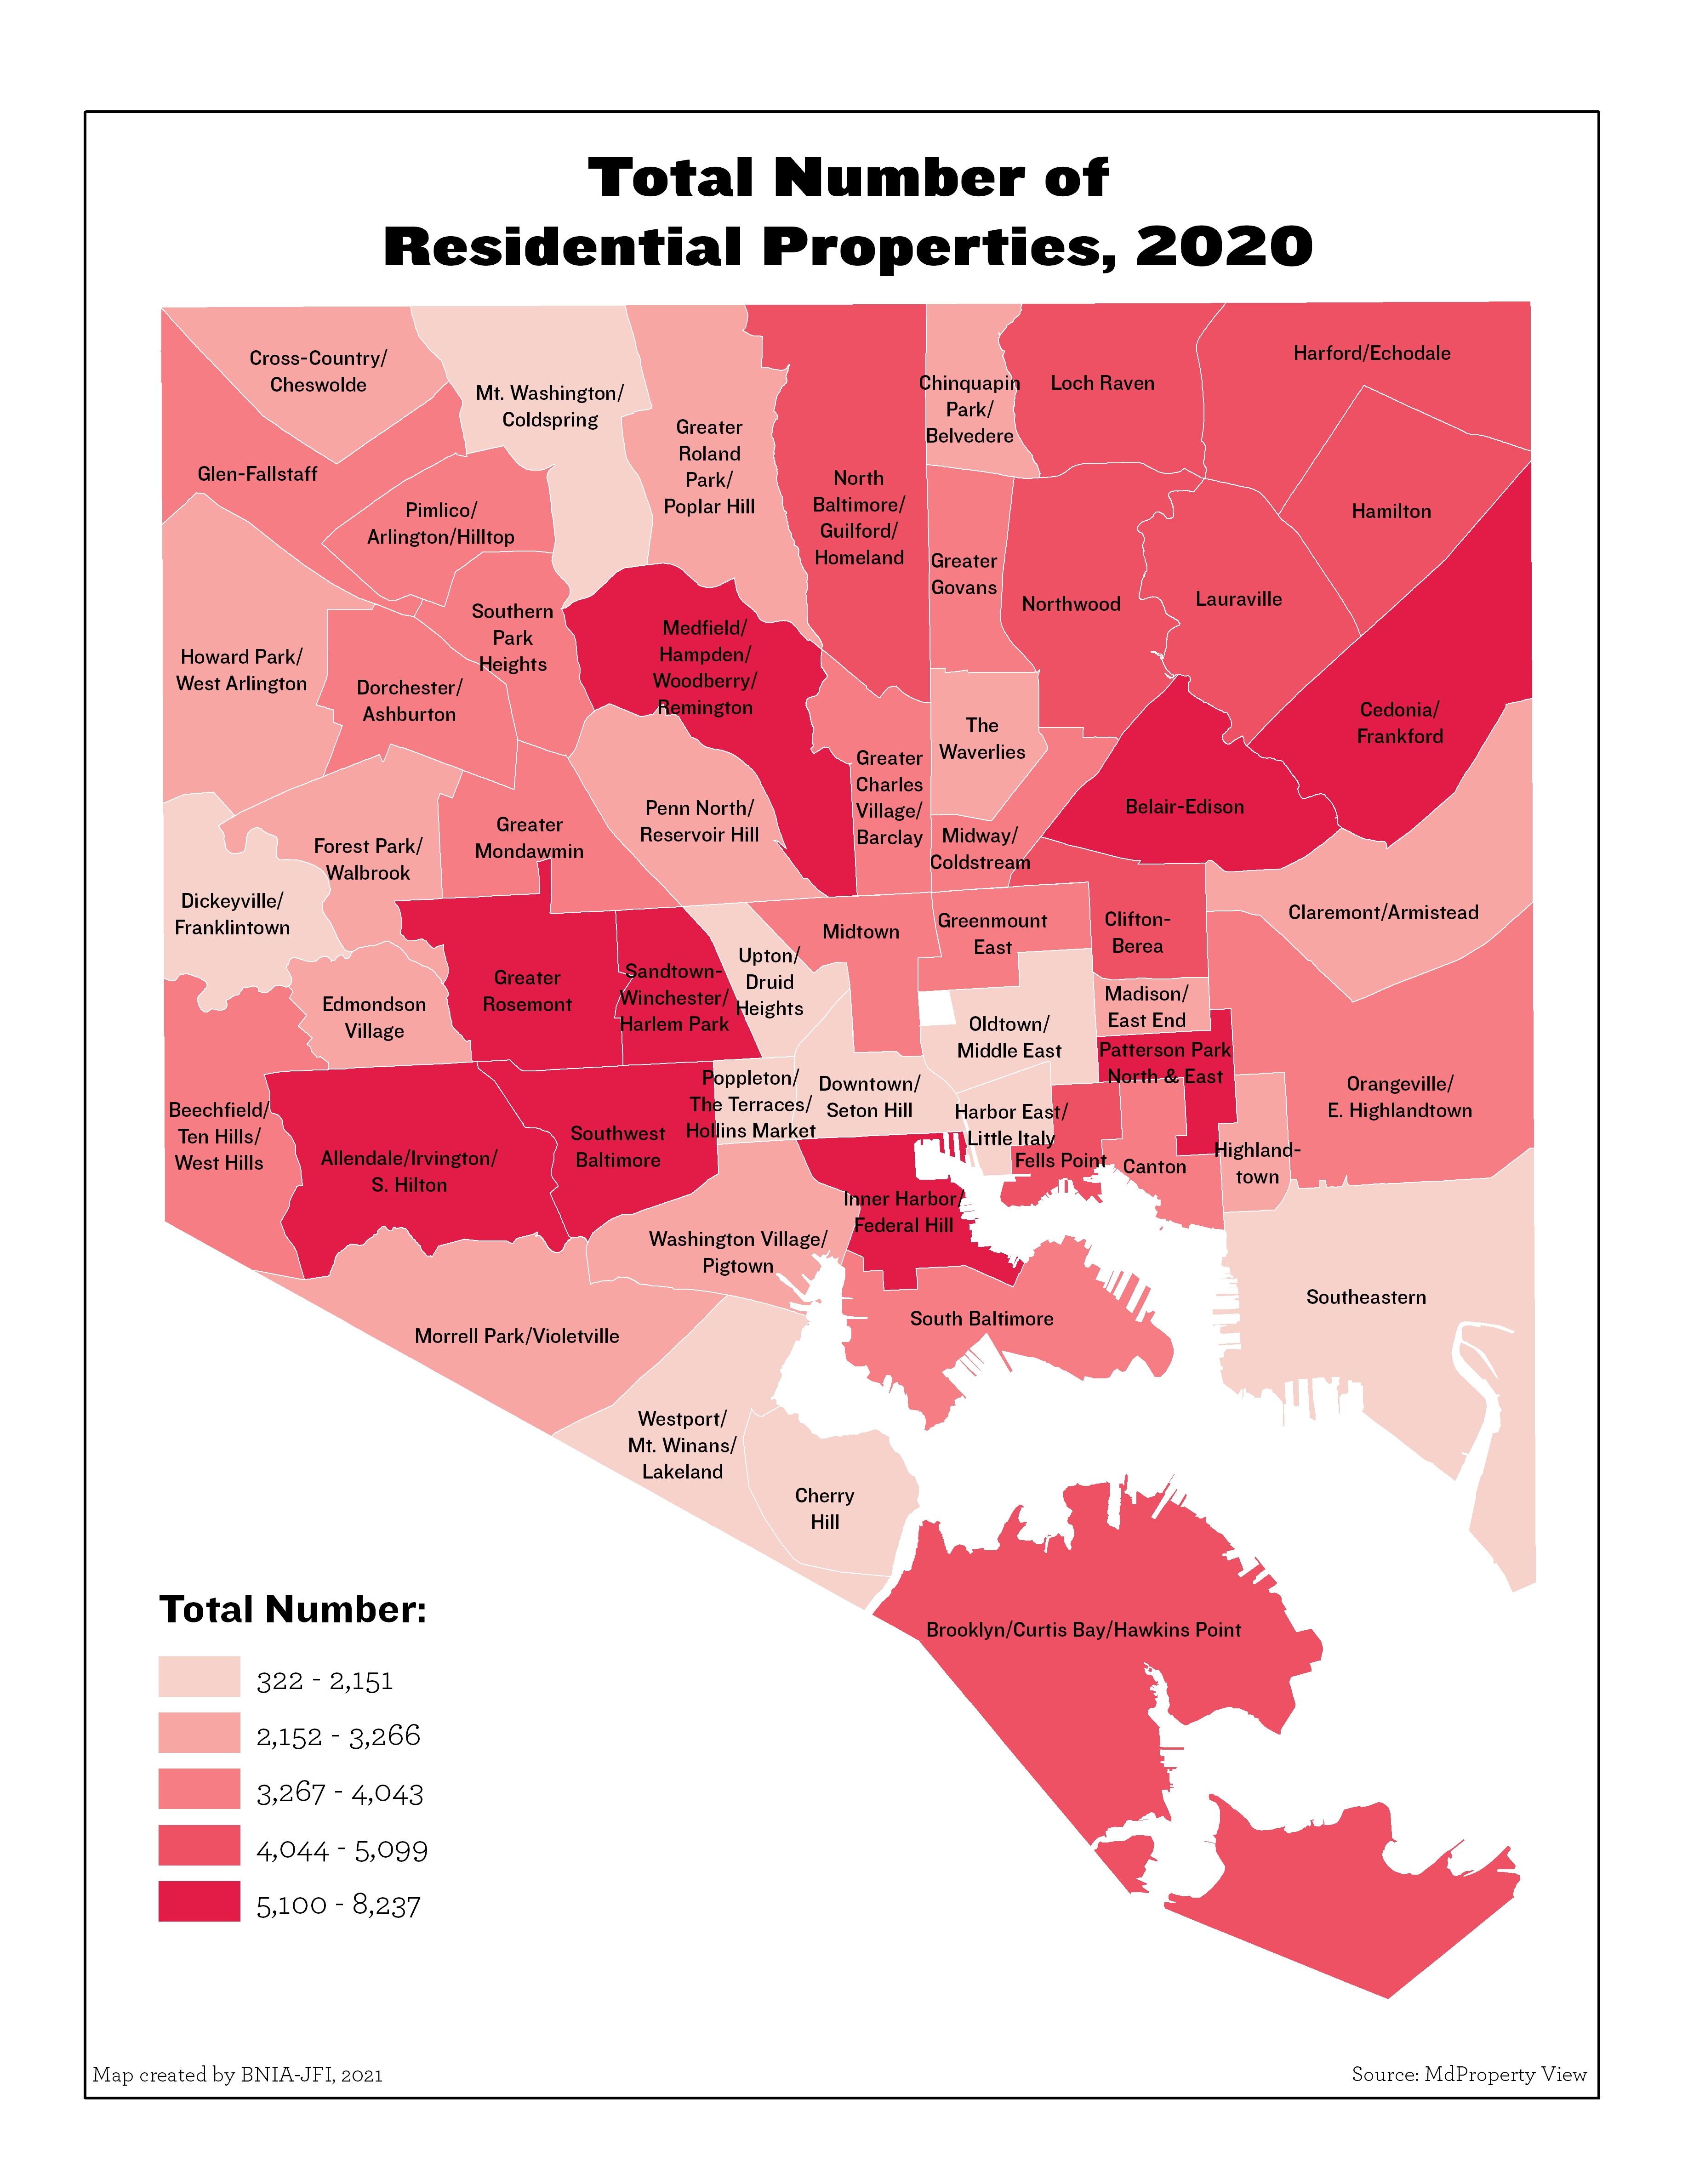
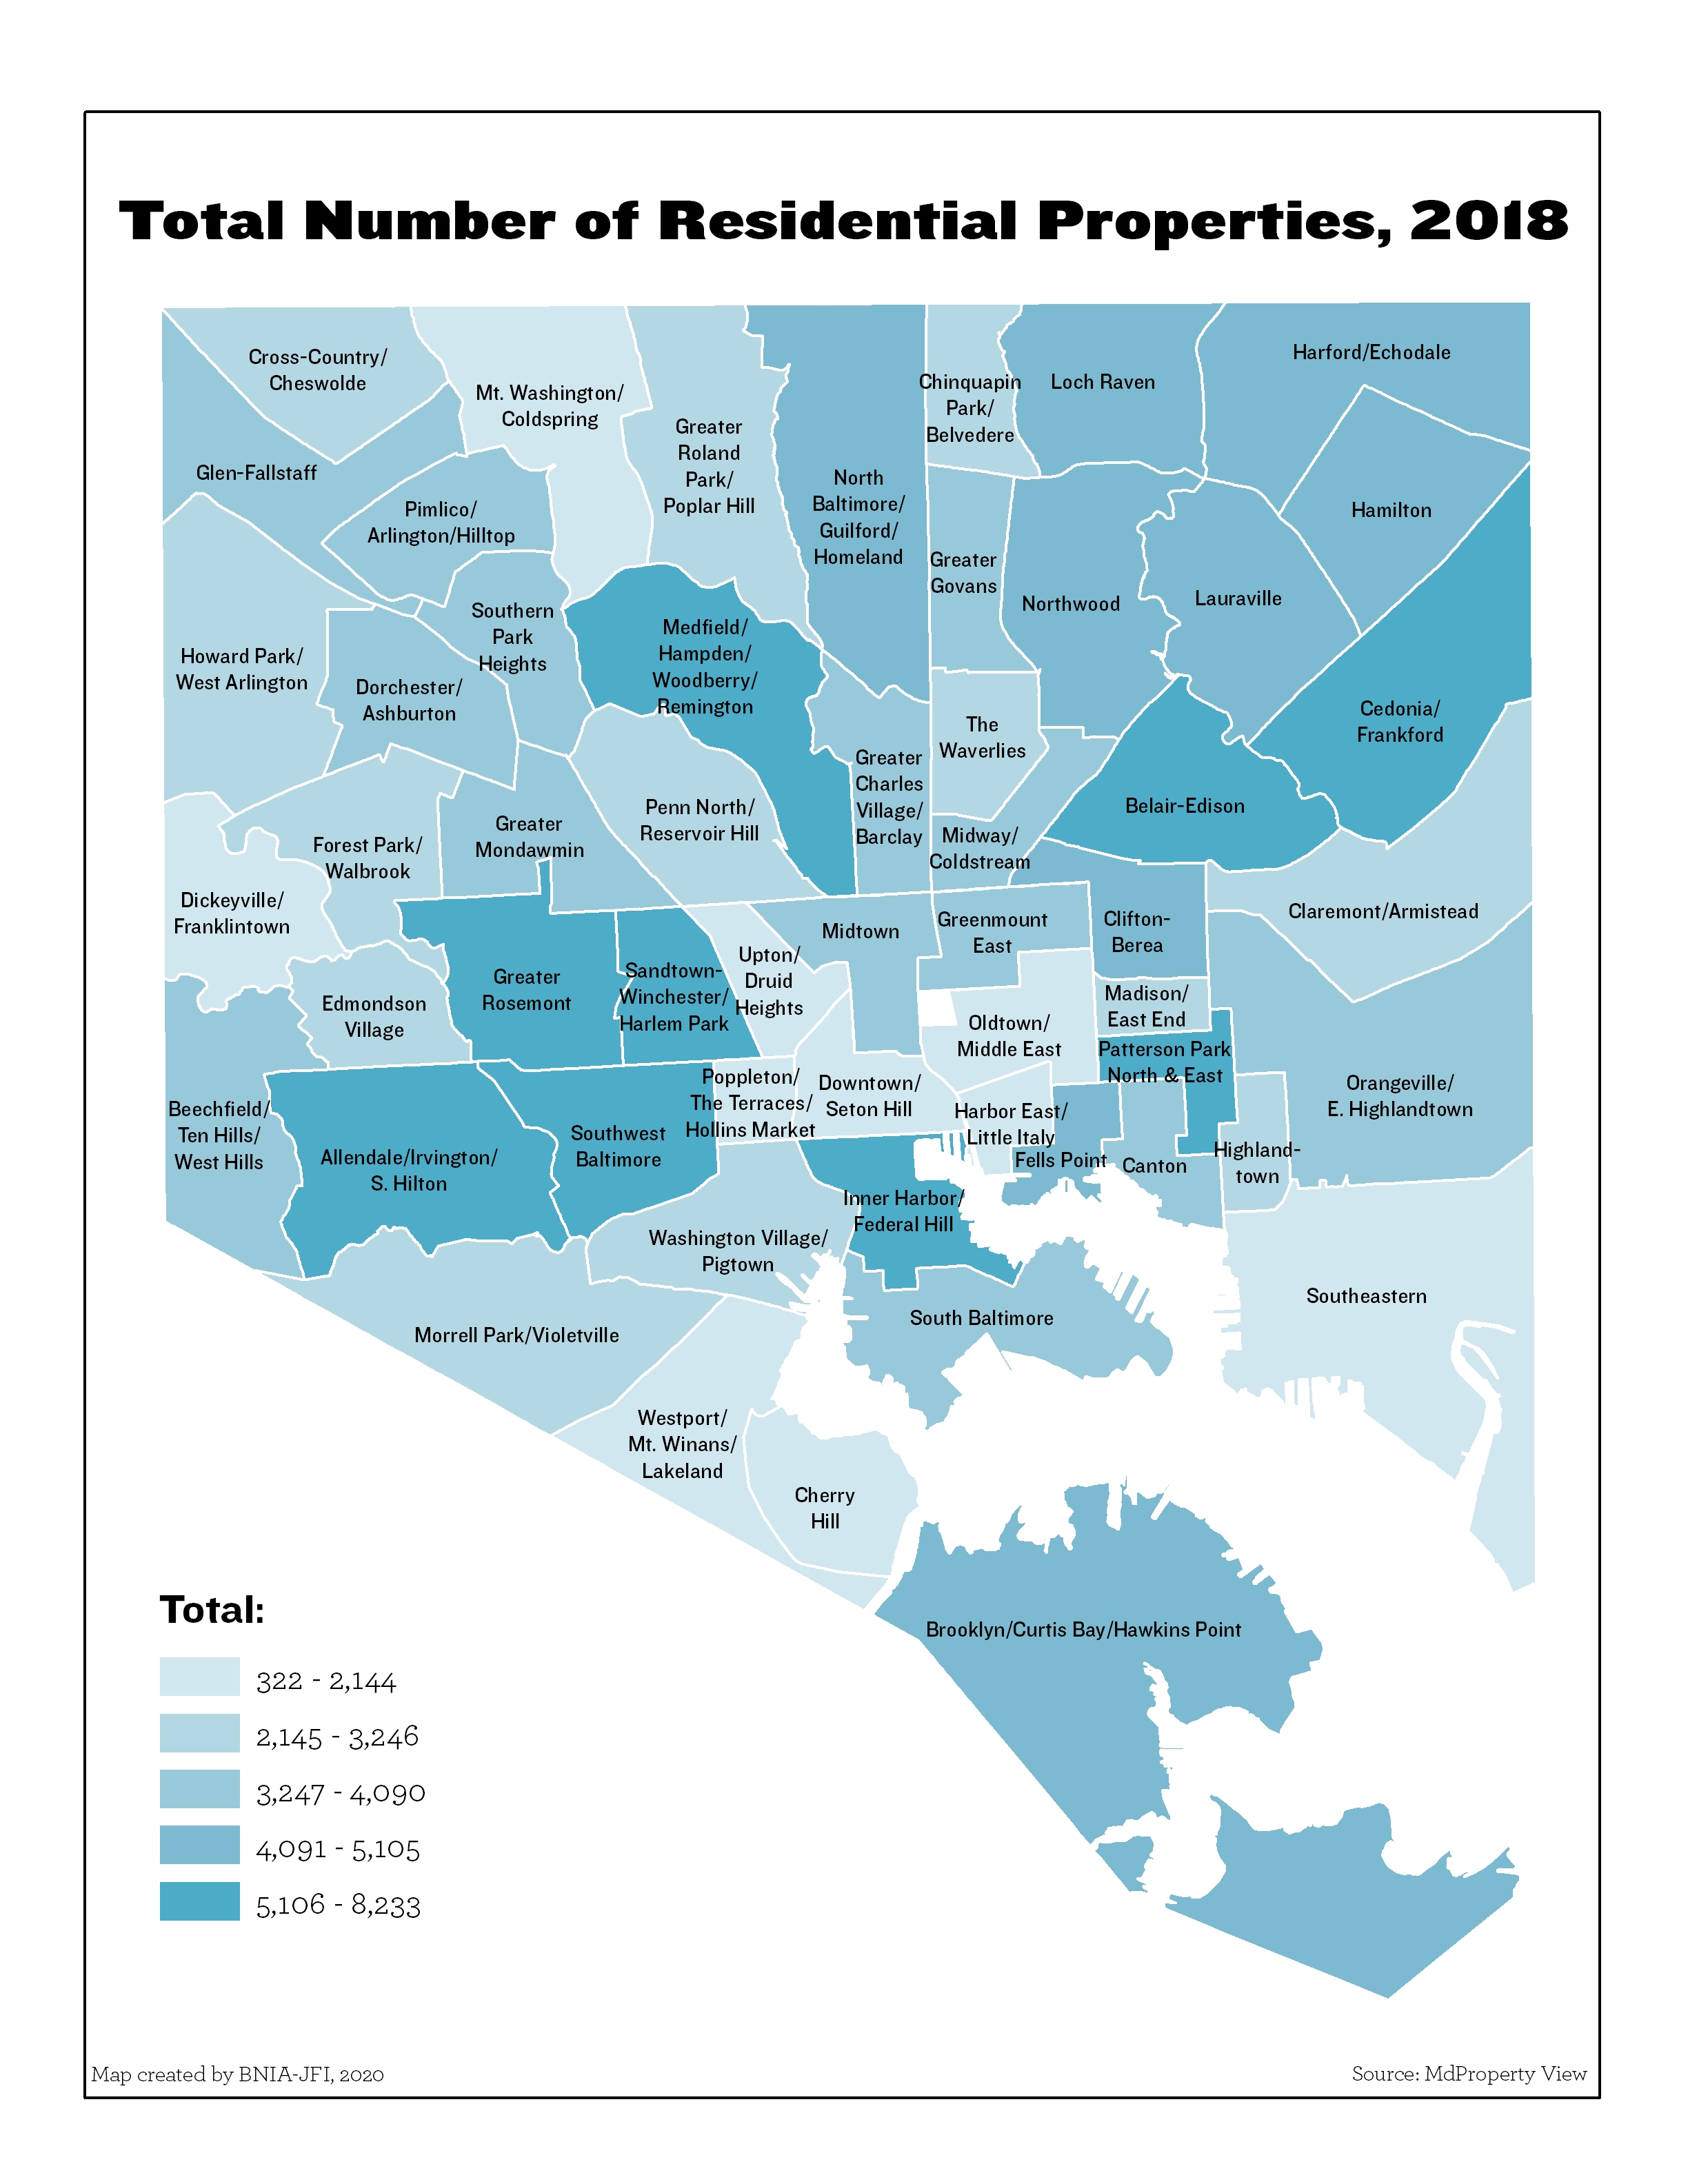
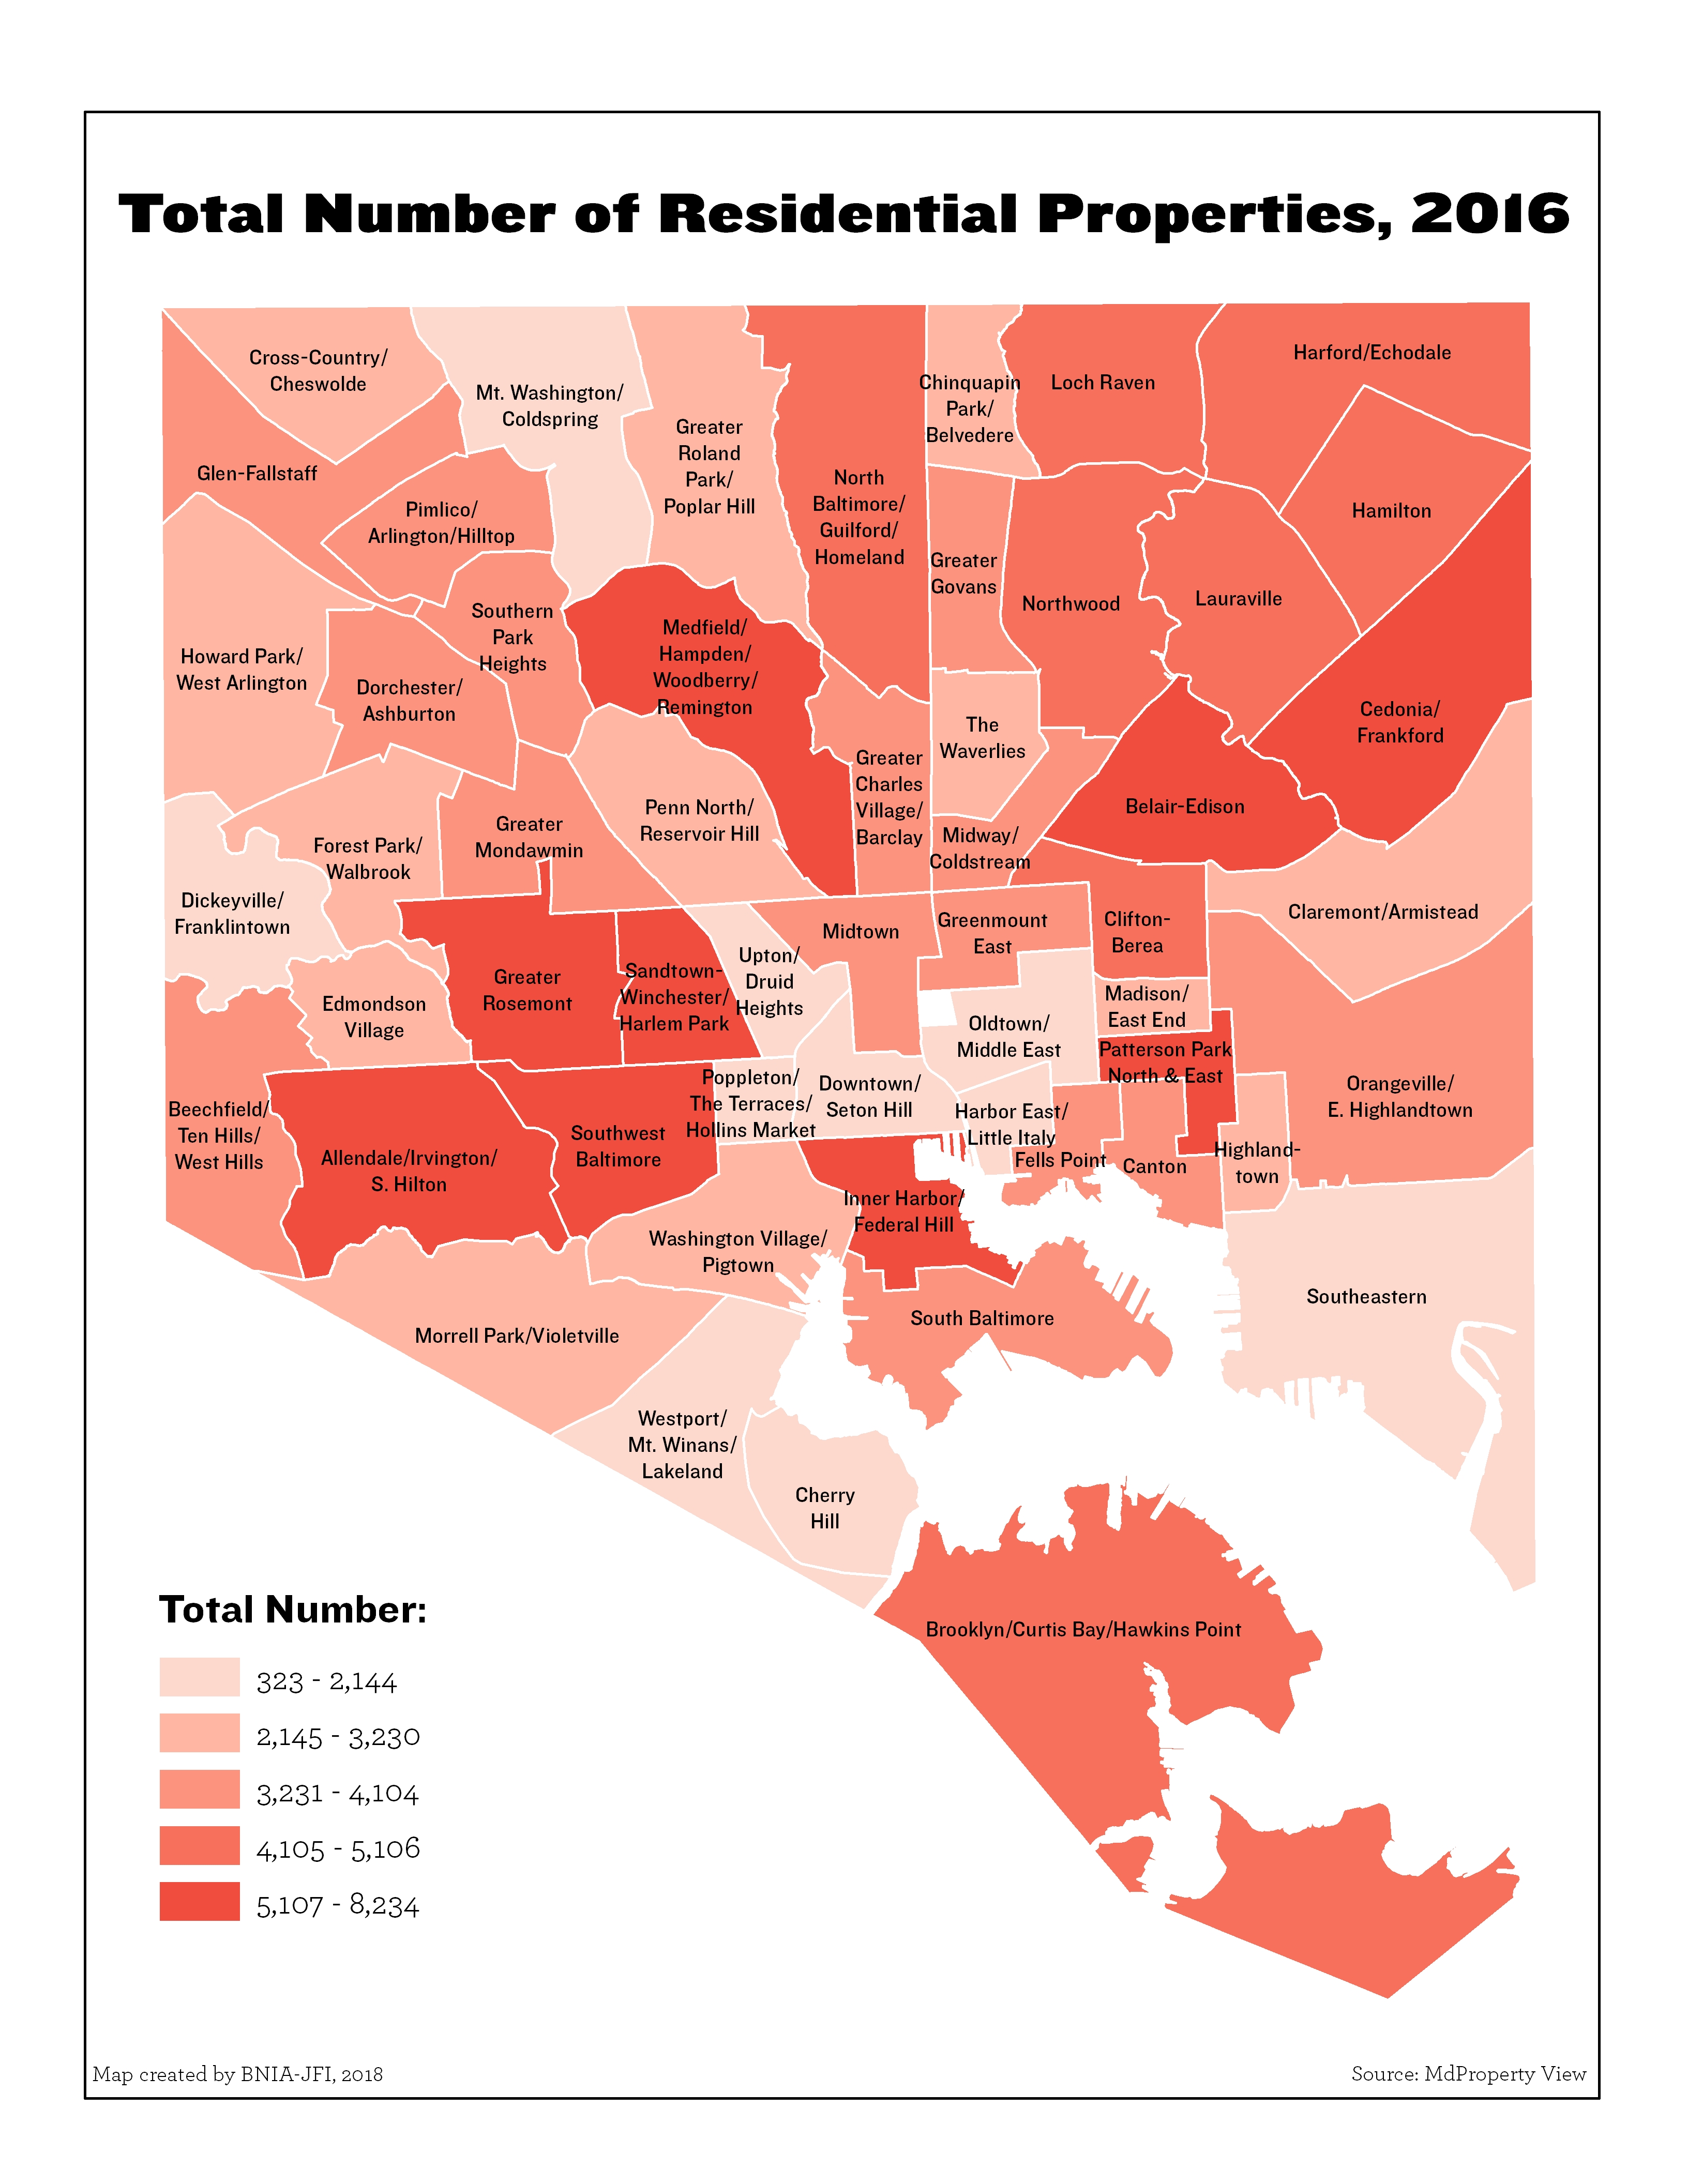
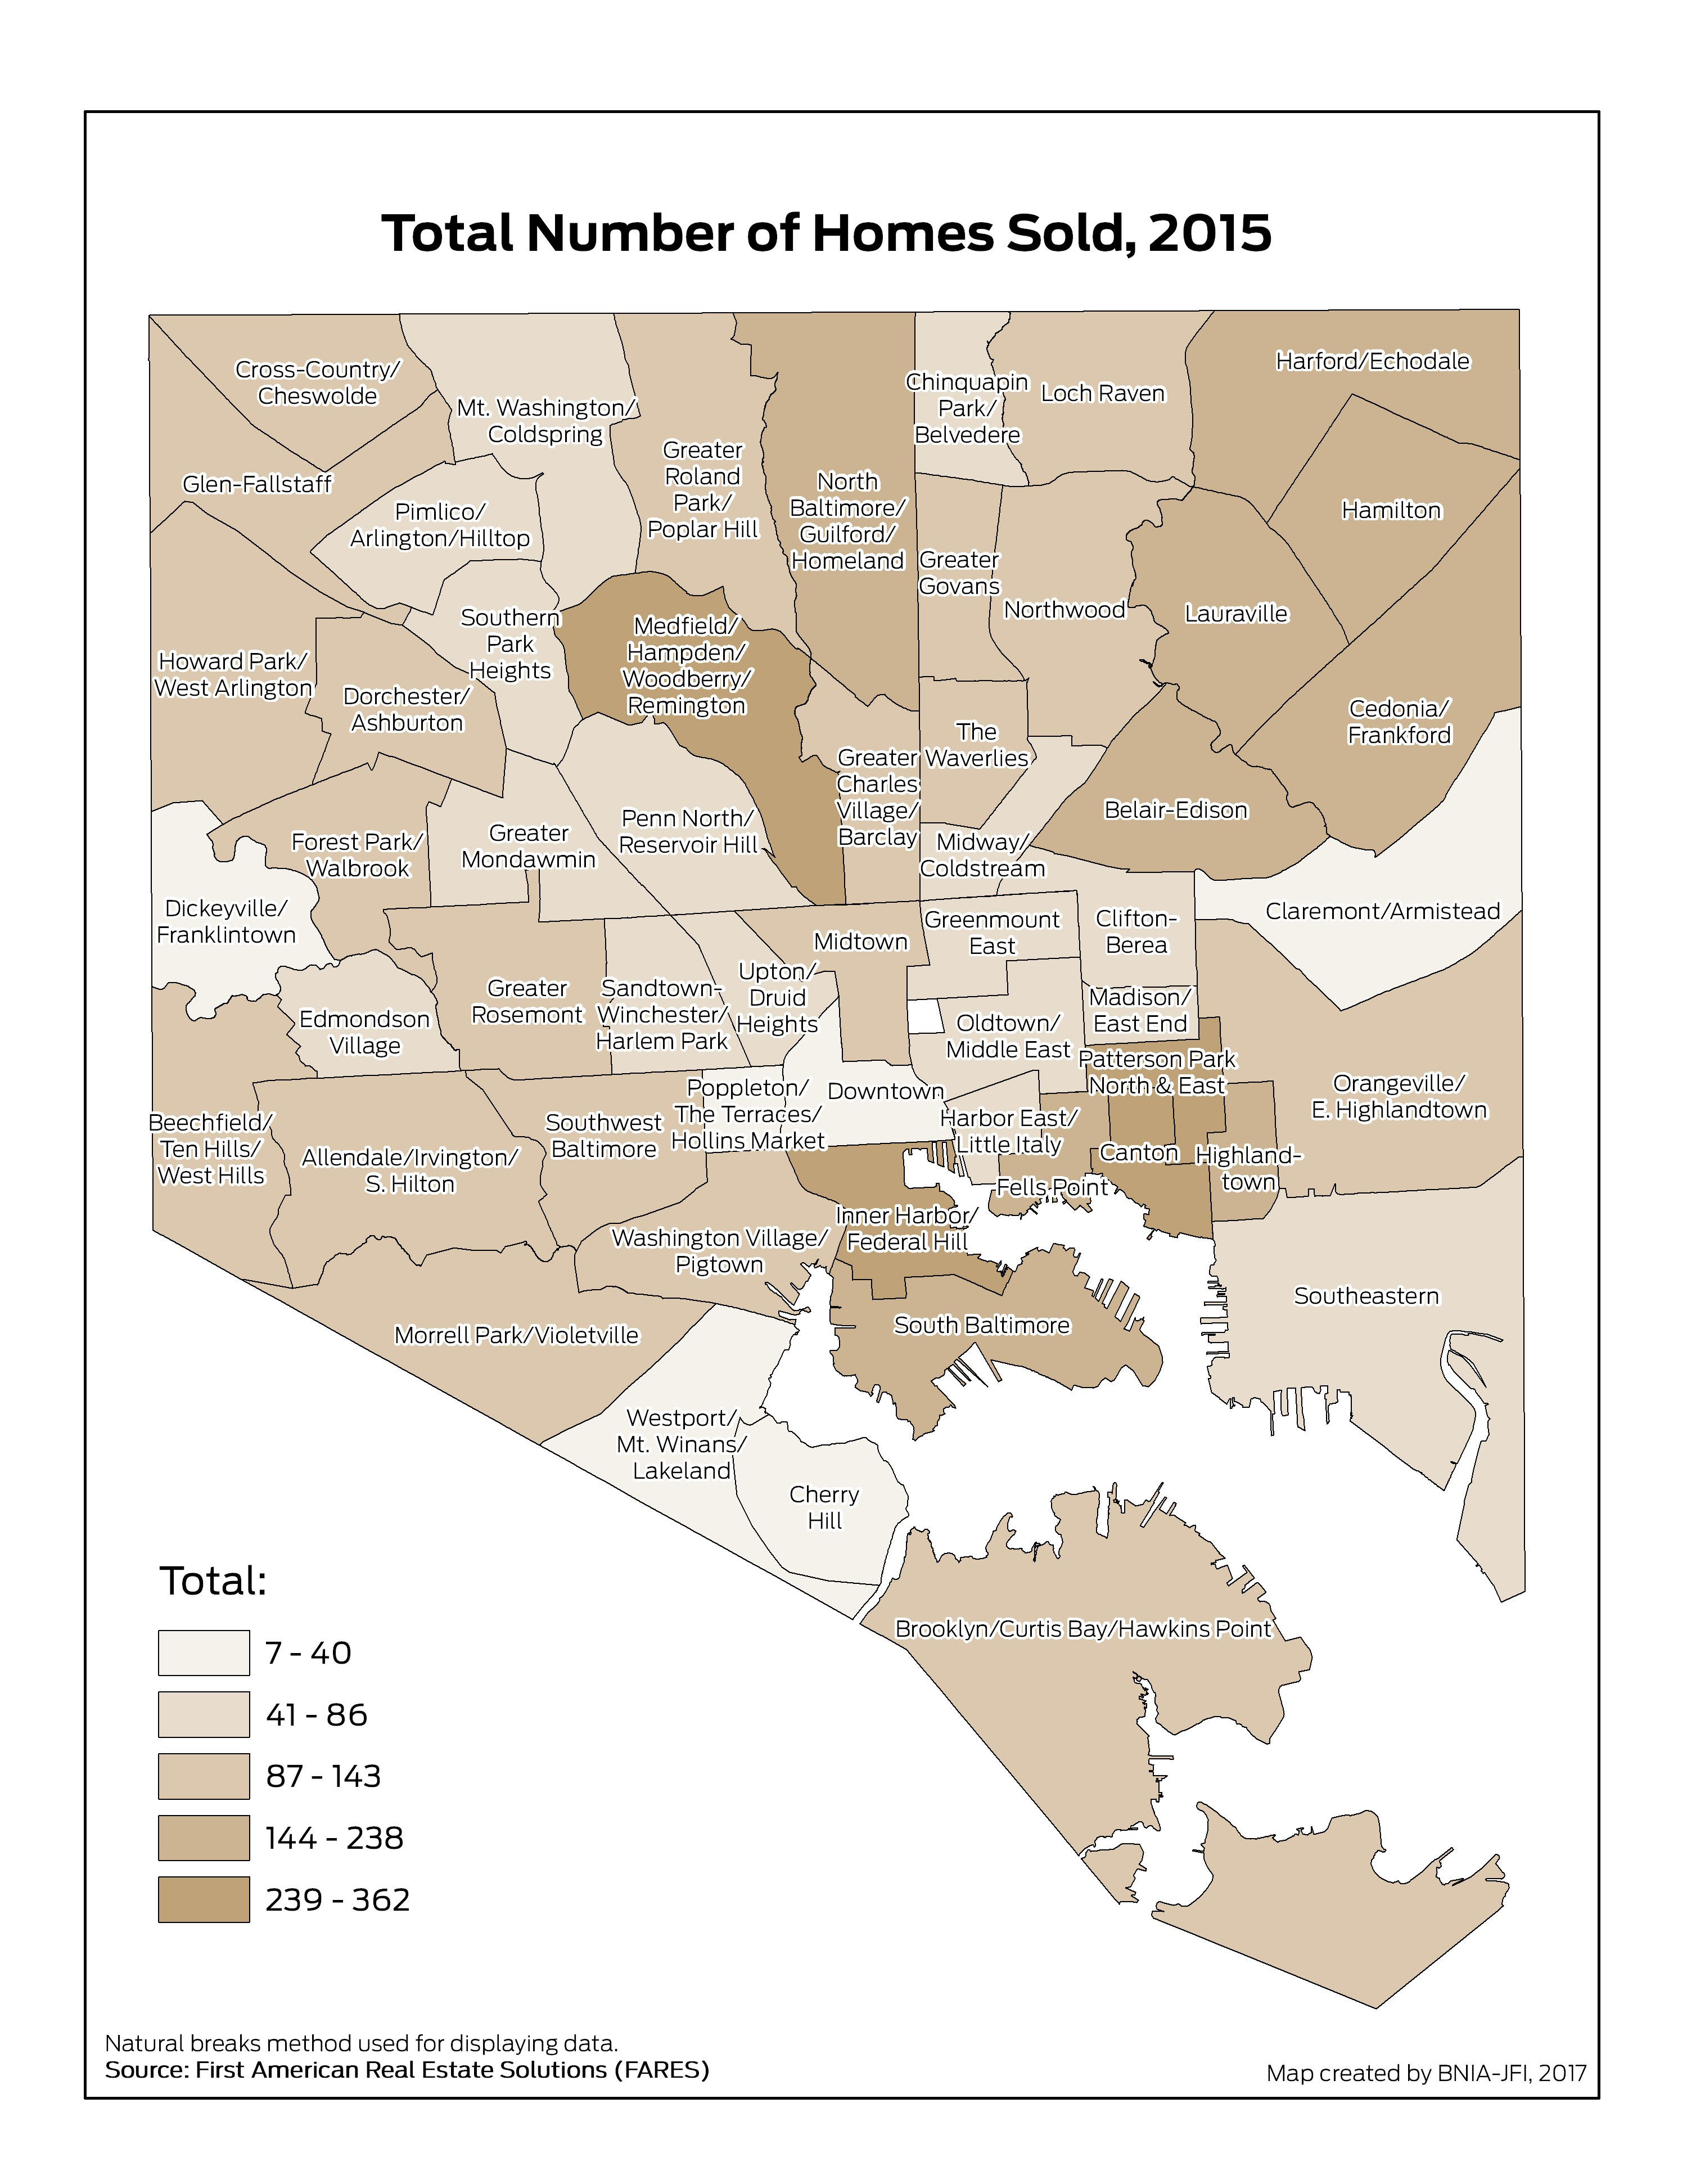
Total Number of Residential Properties

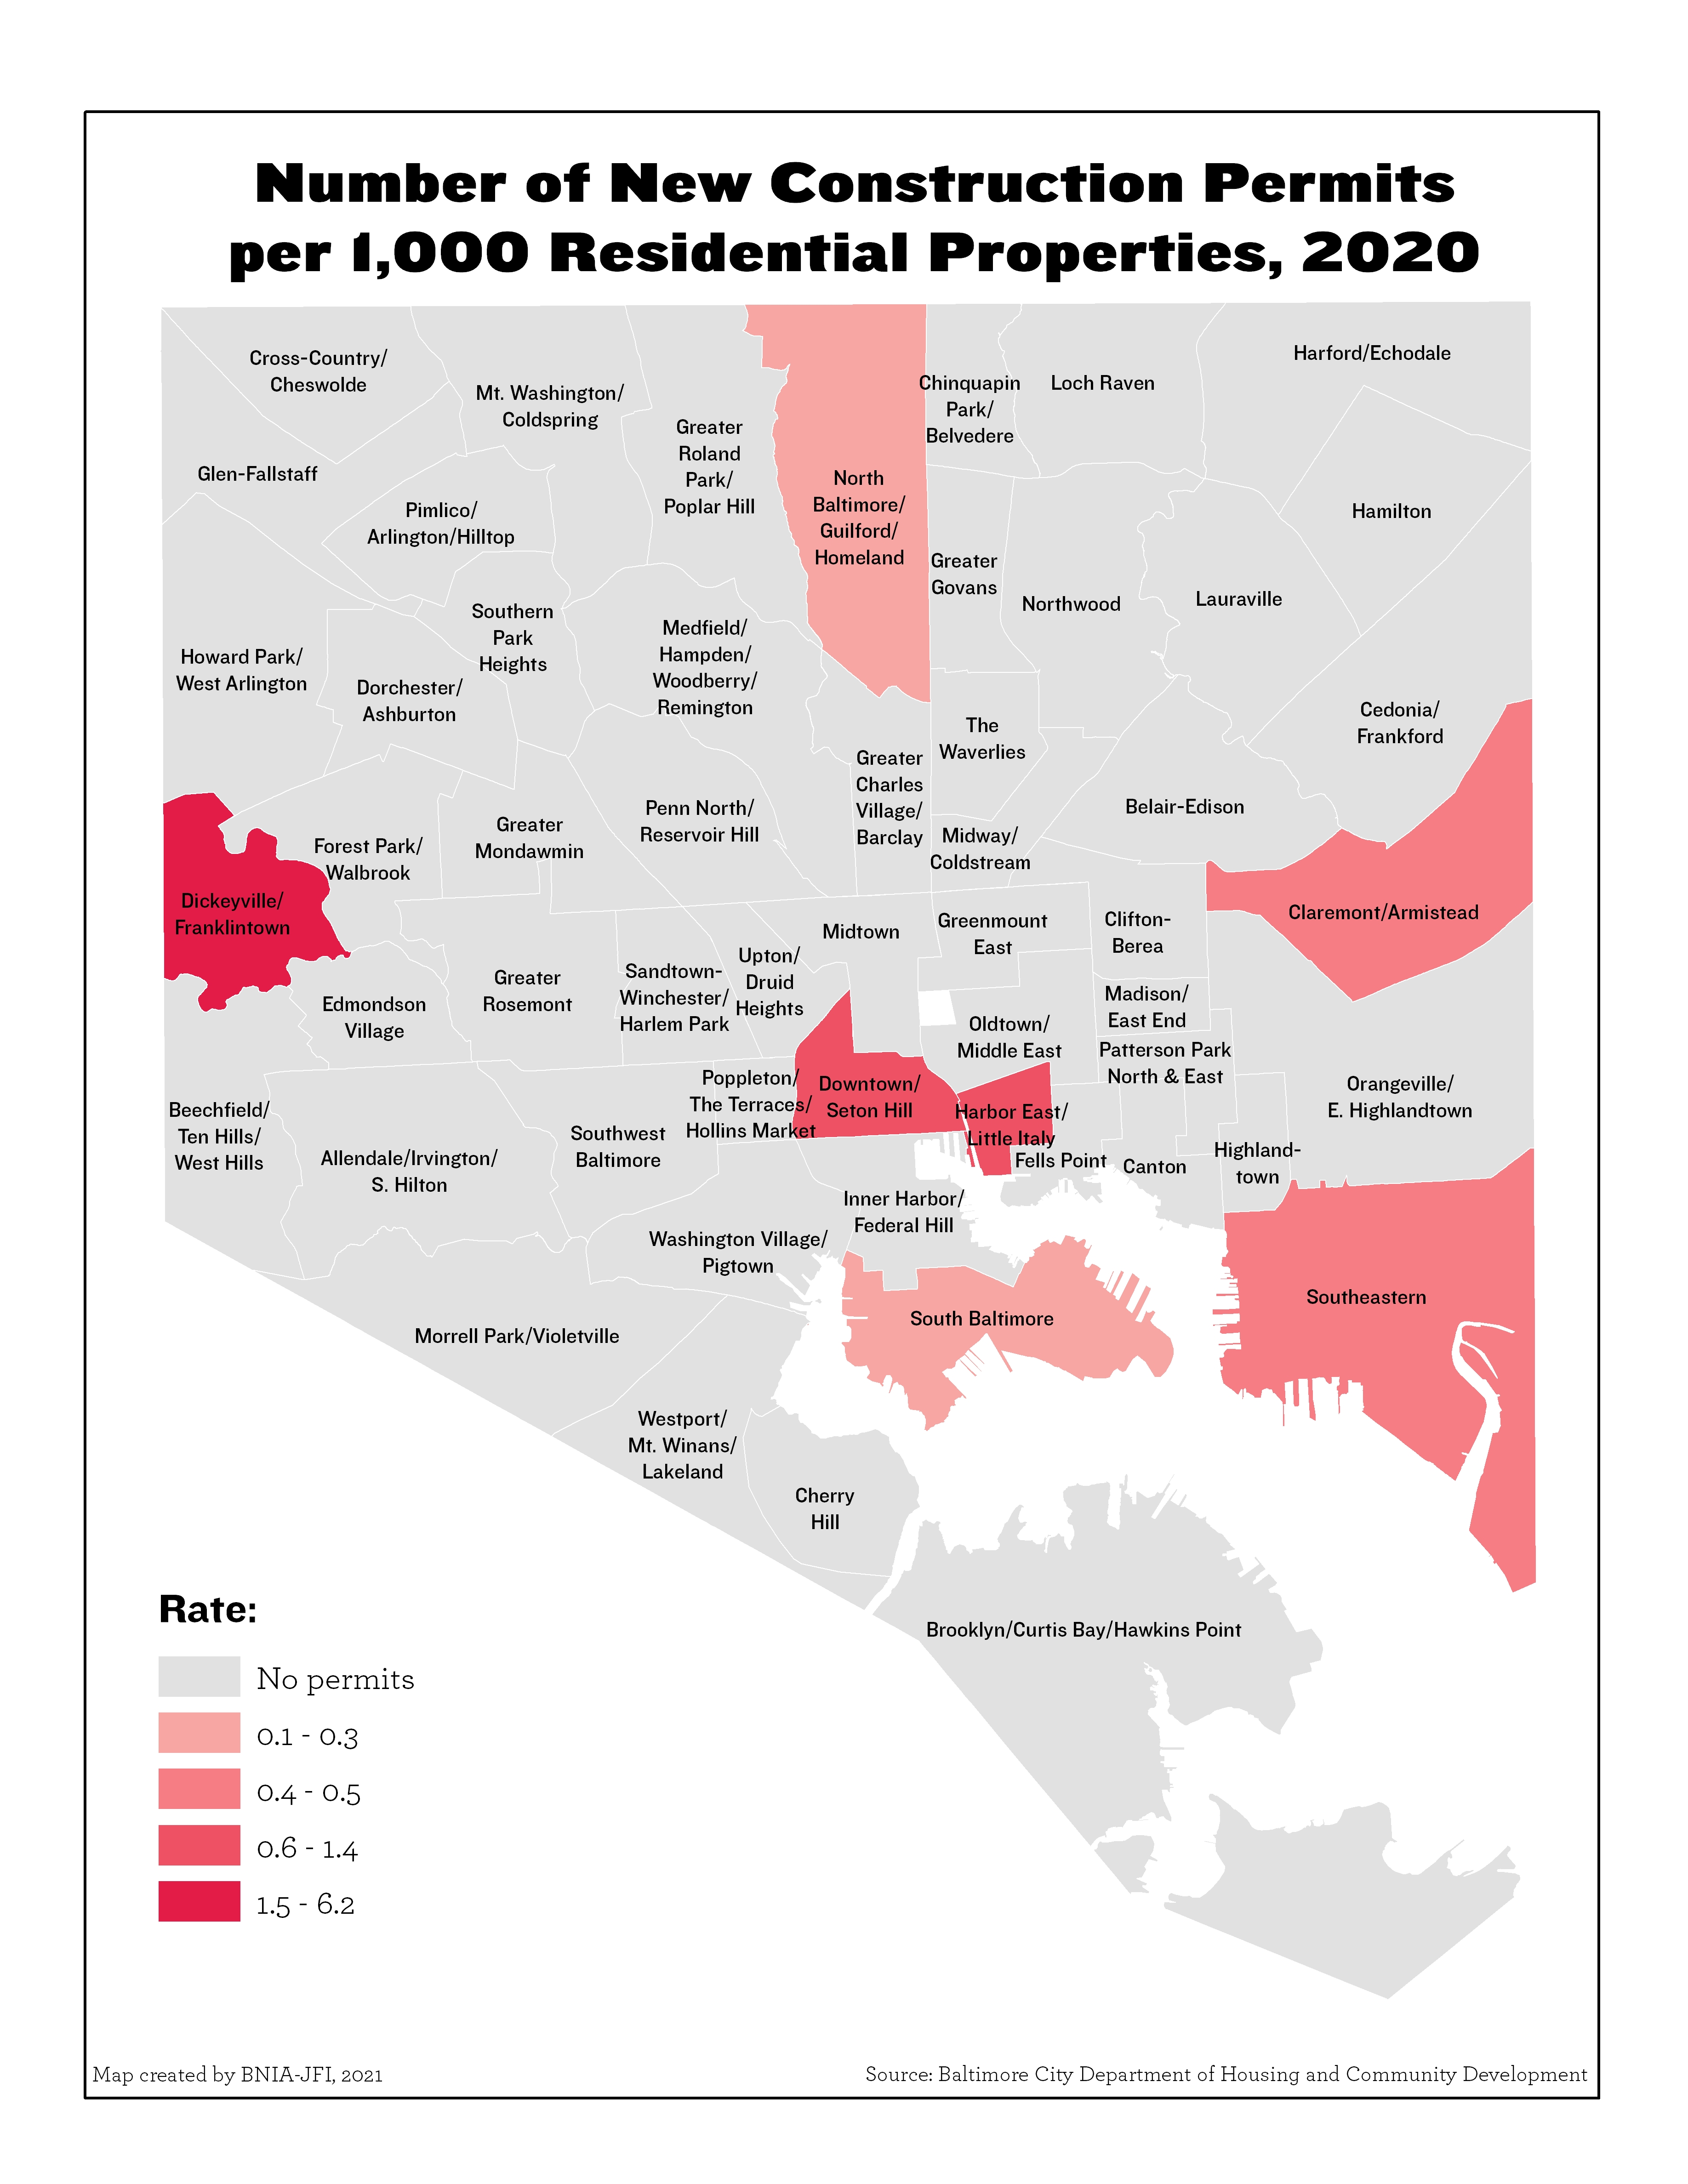
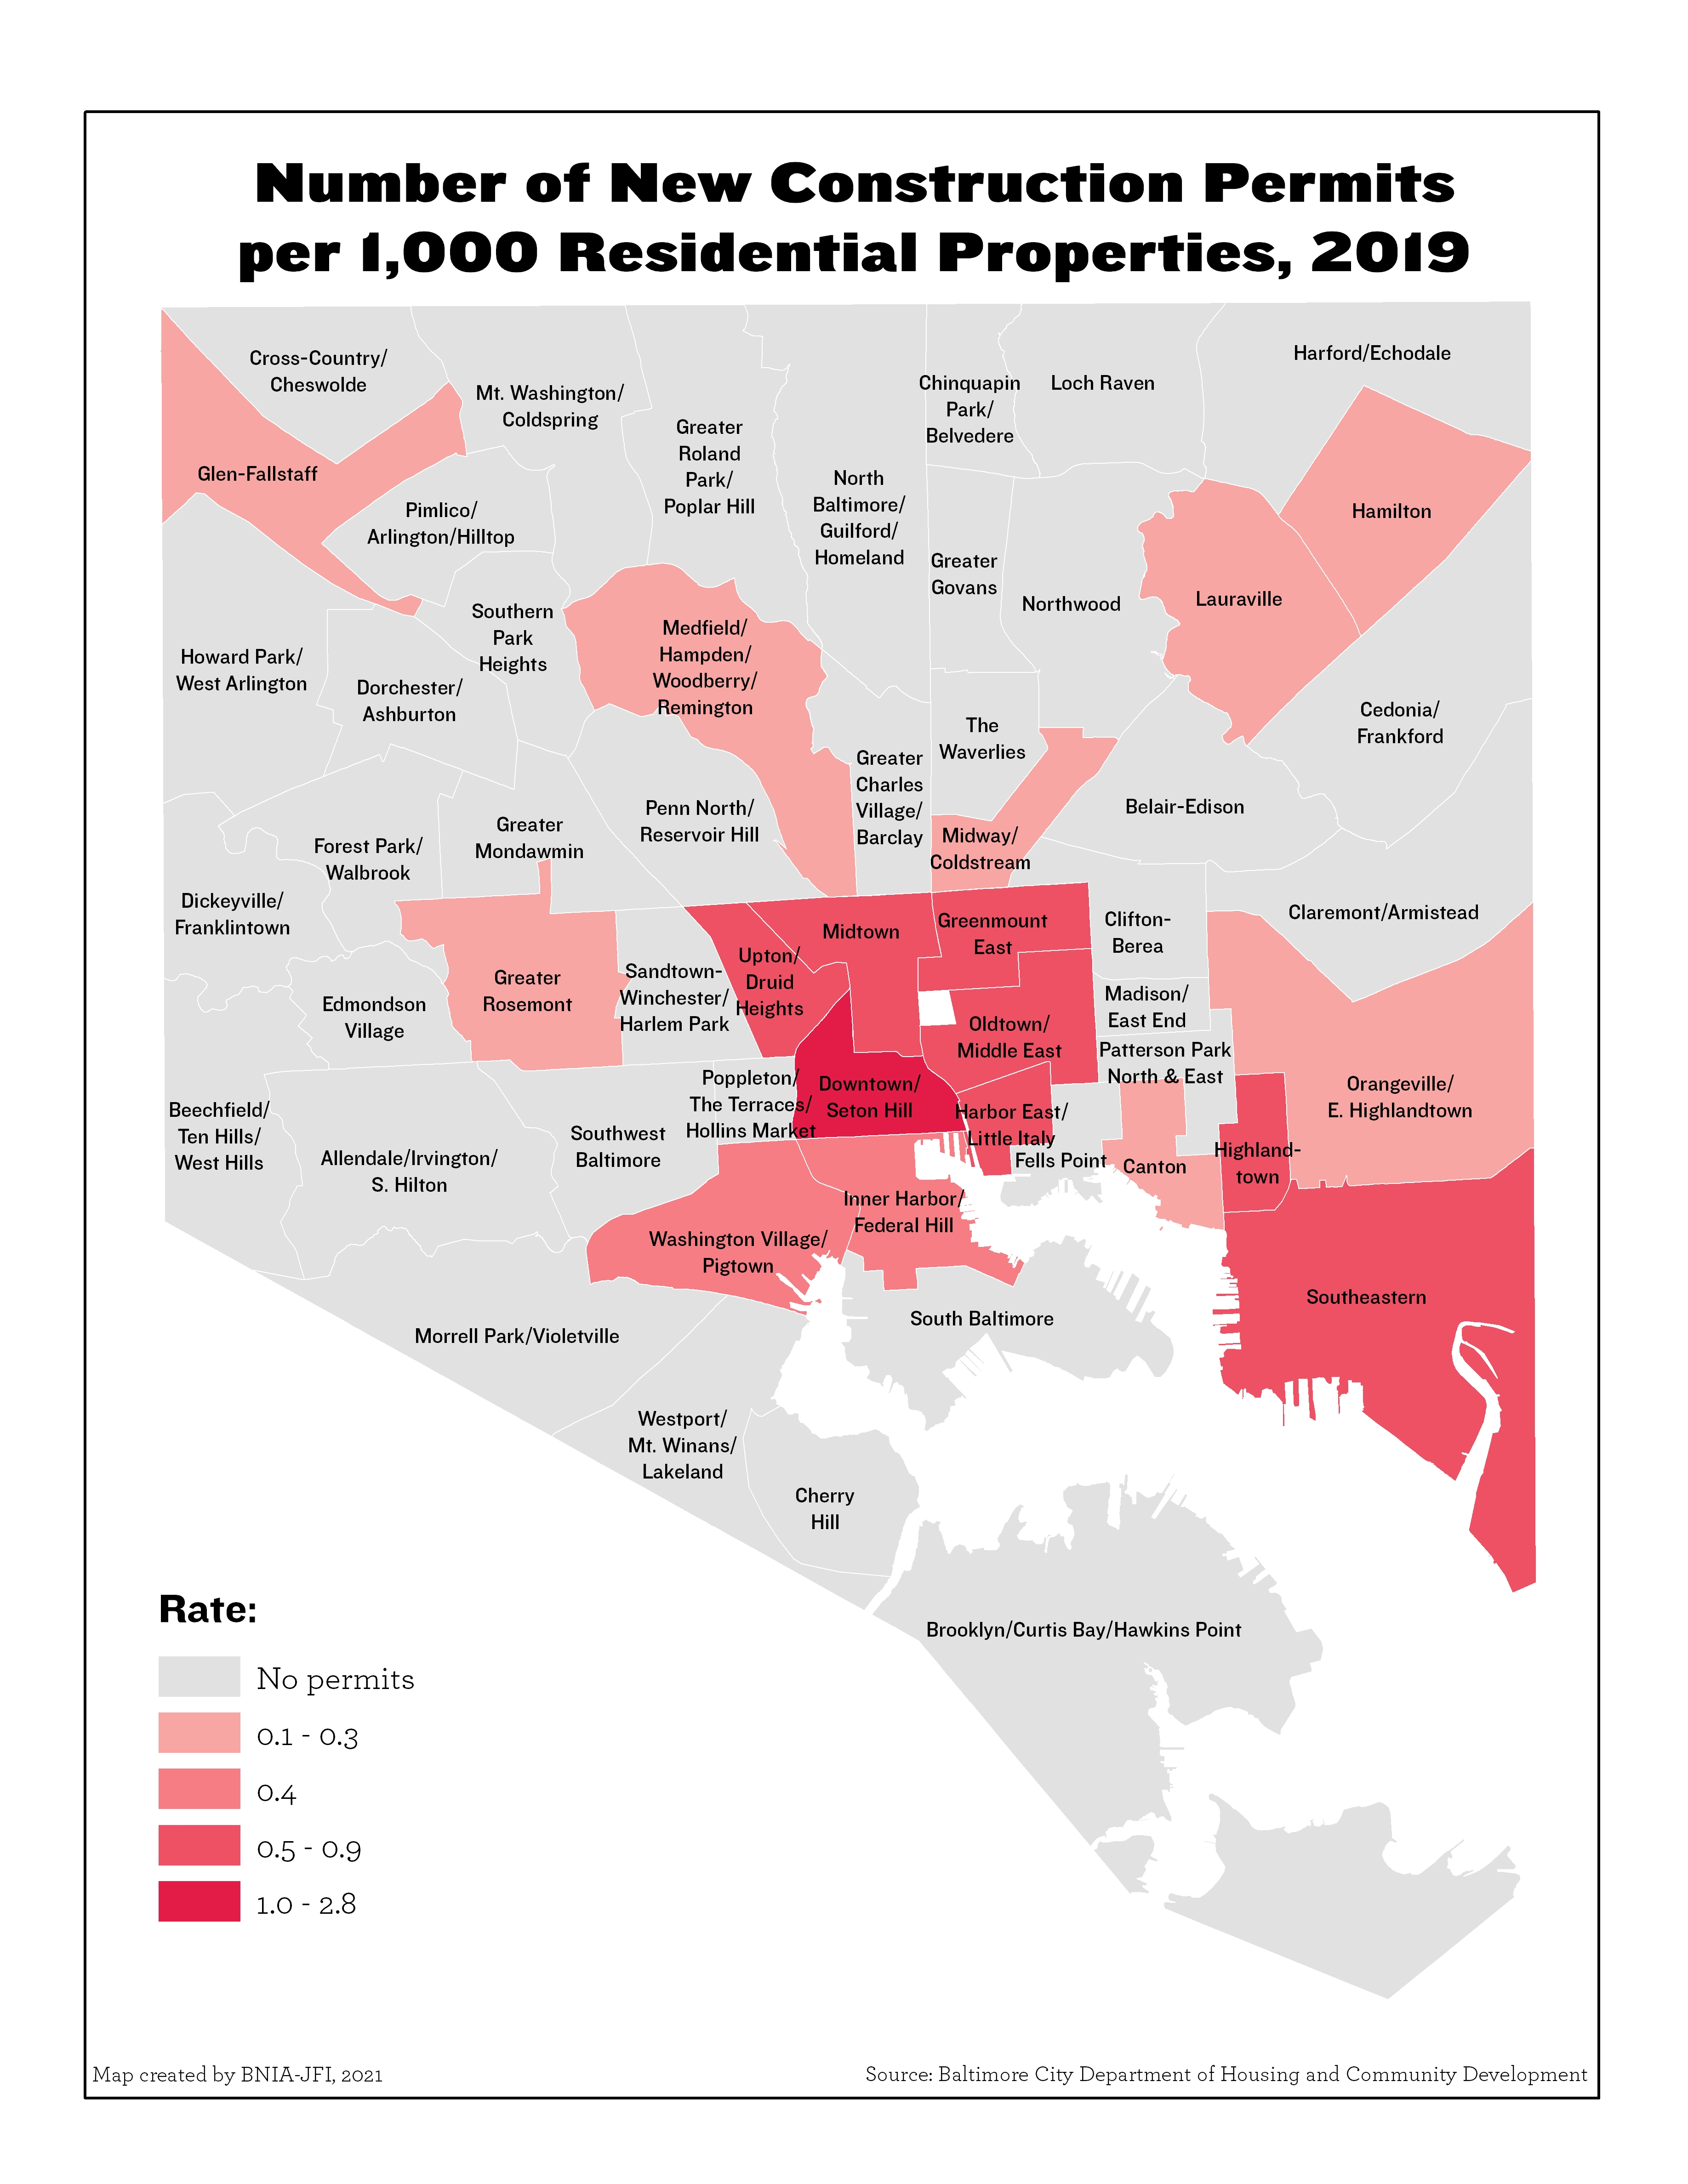
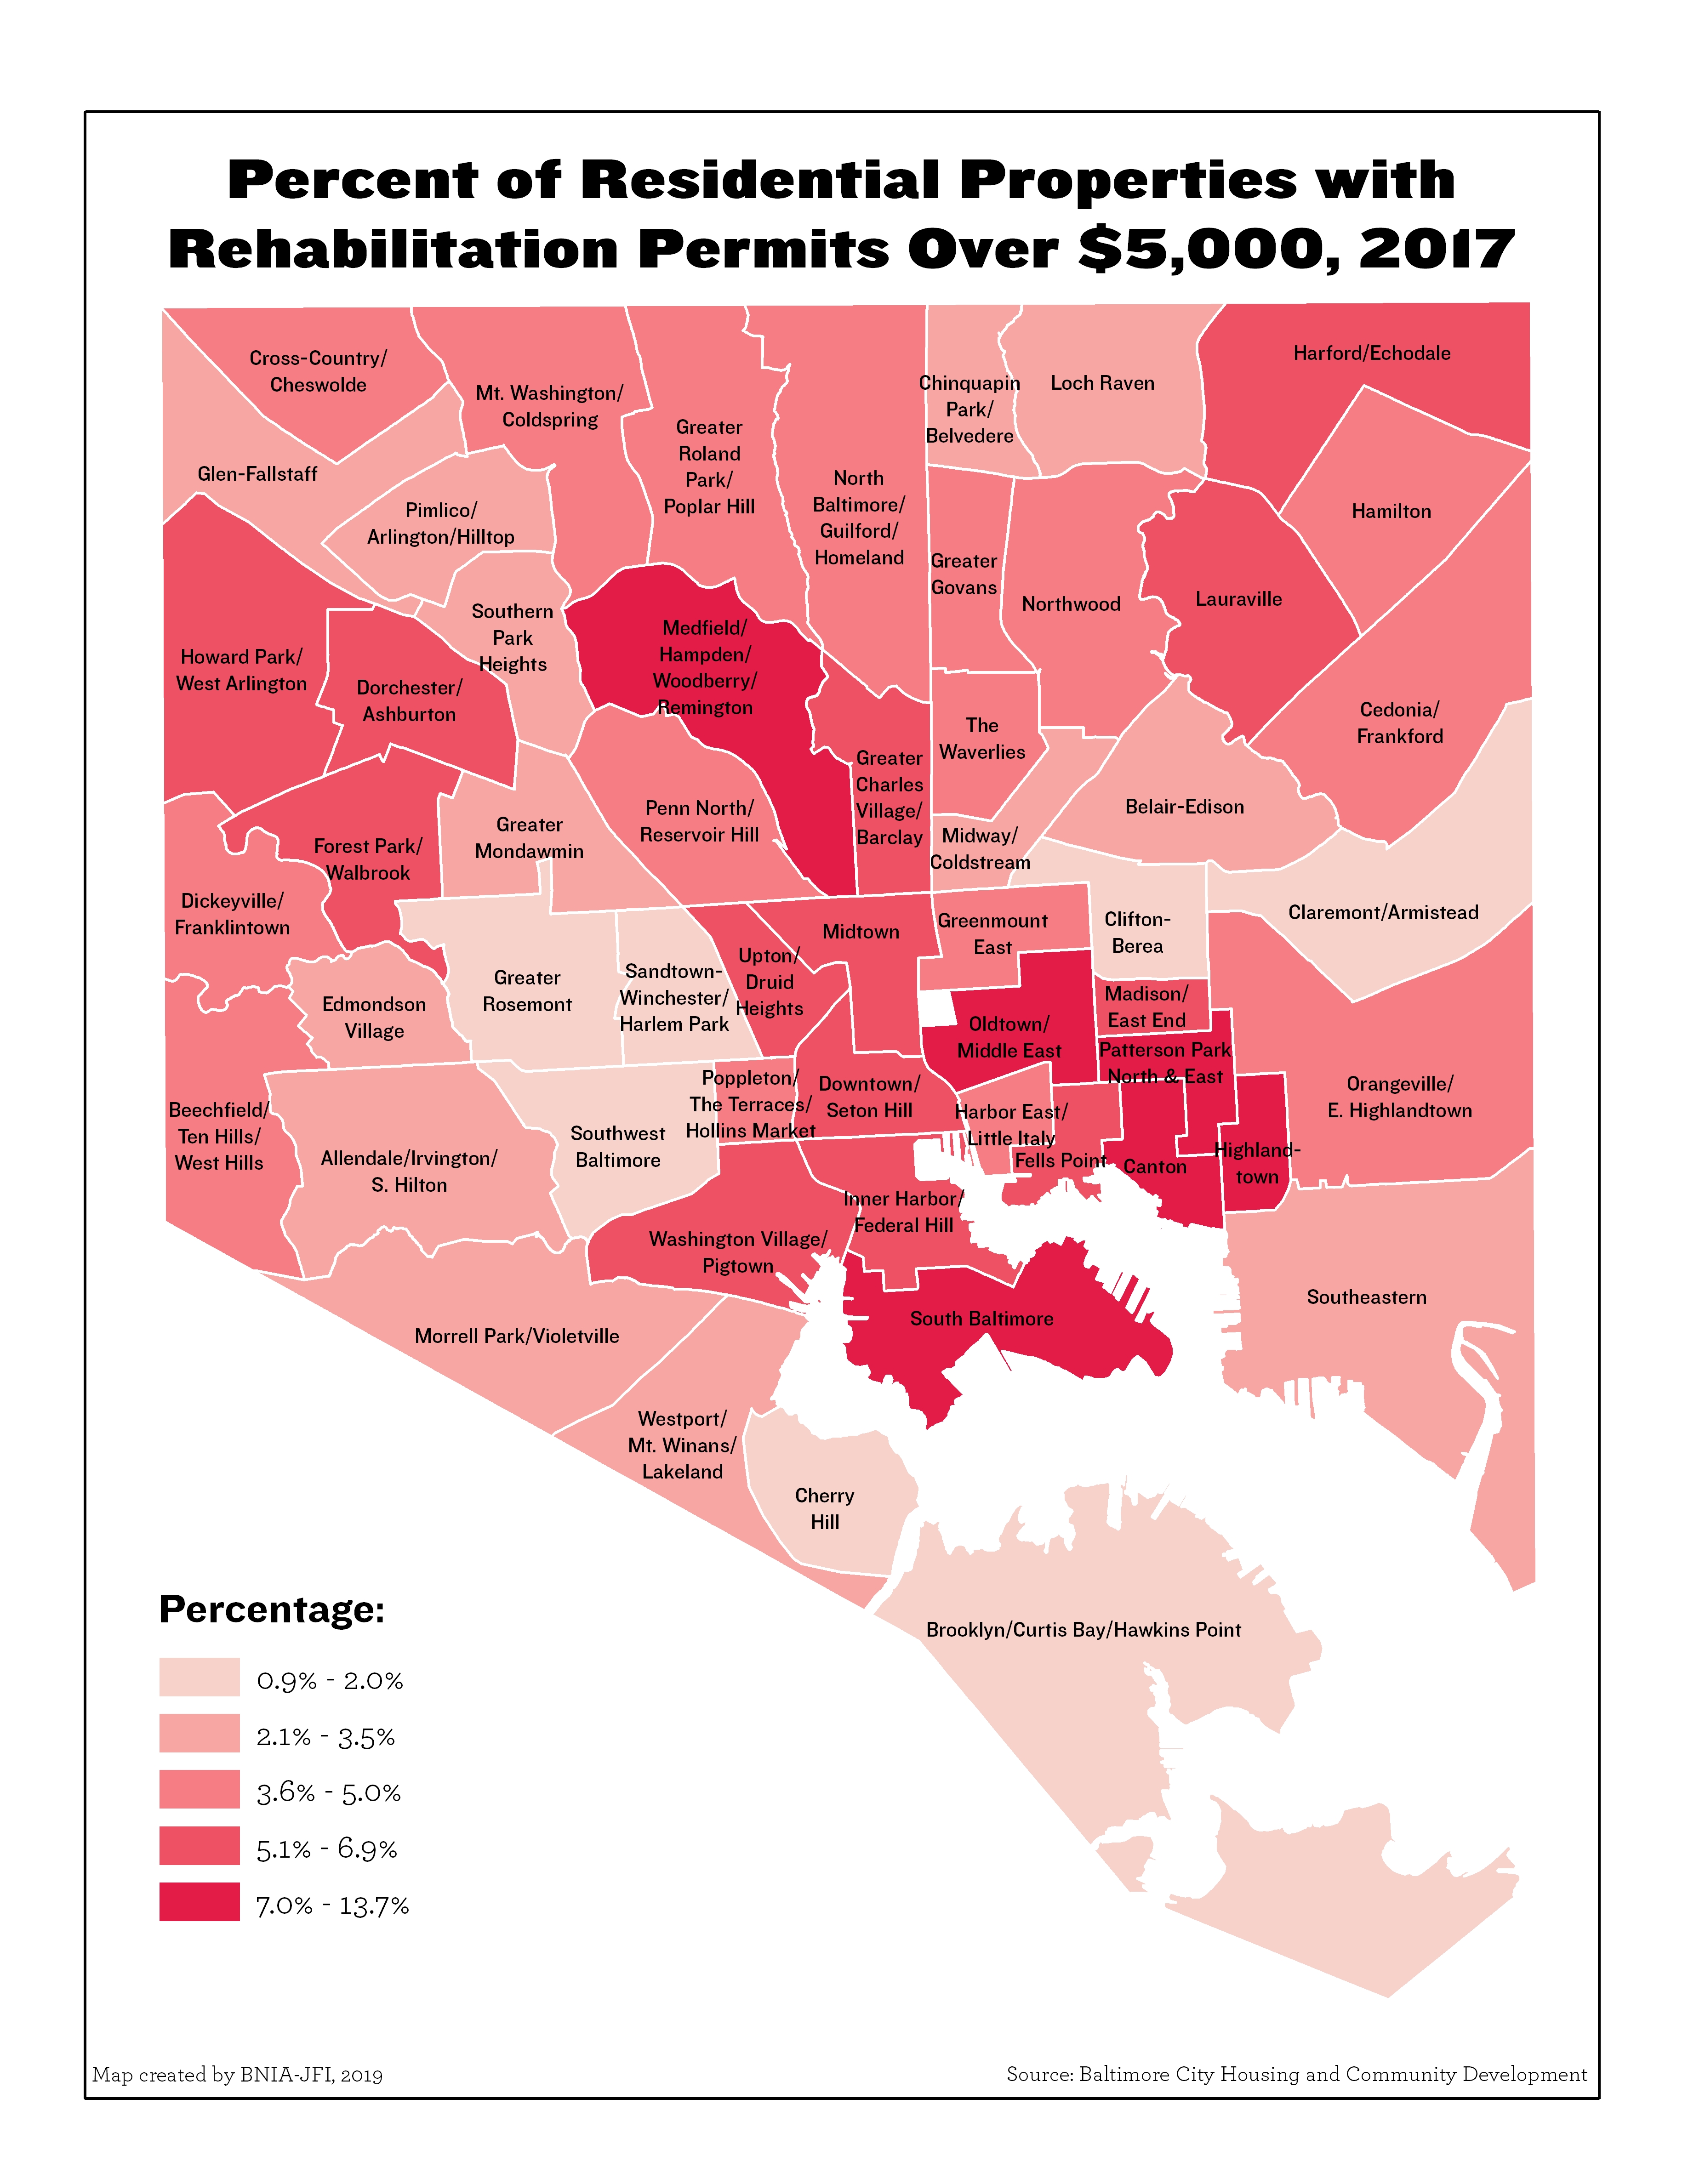
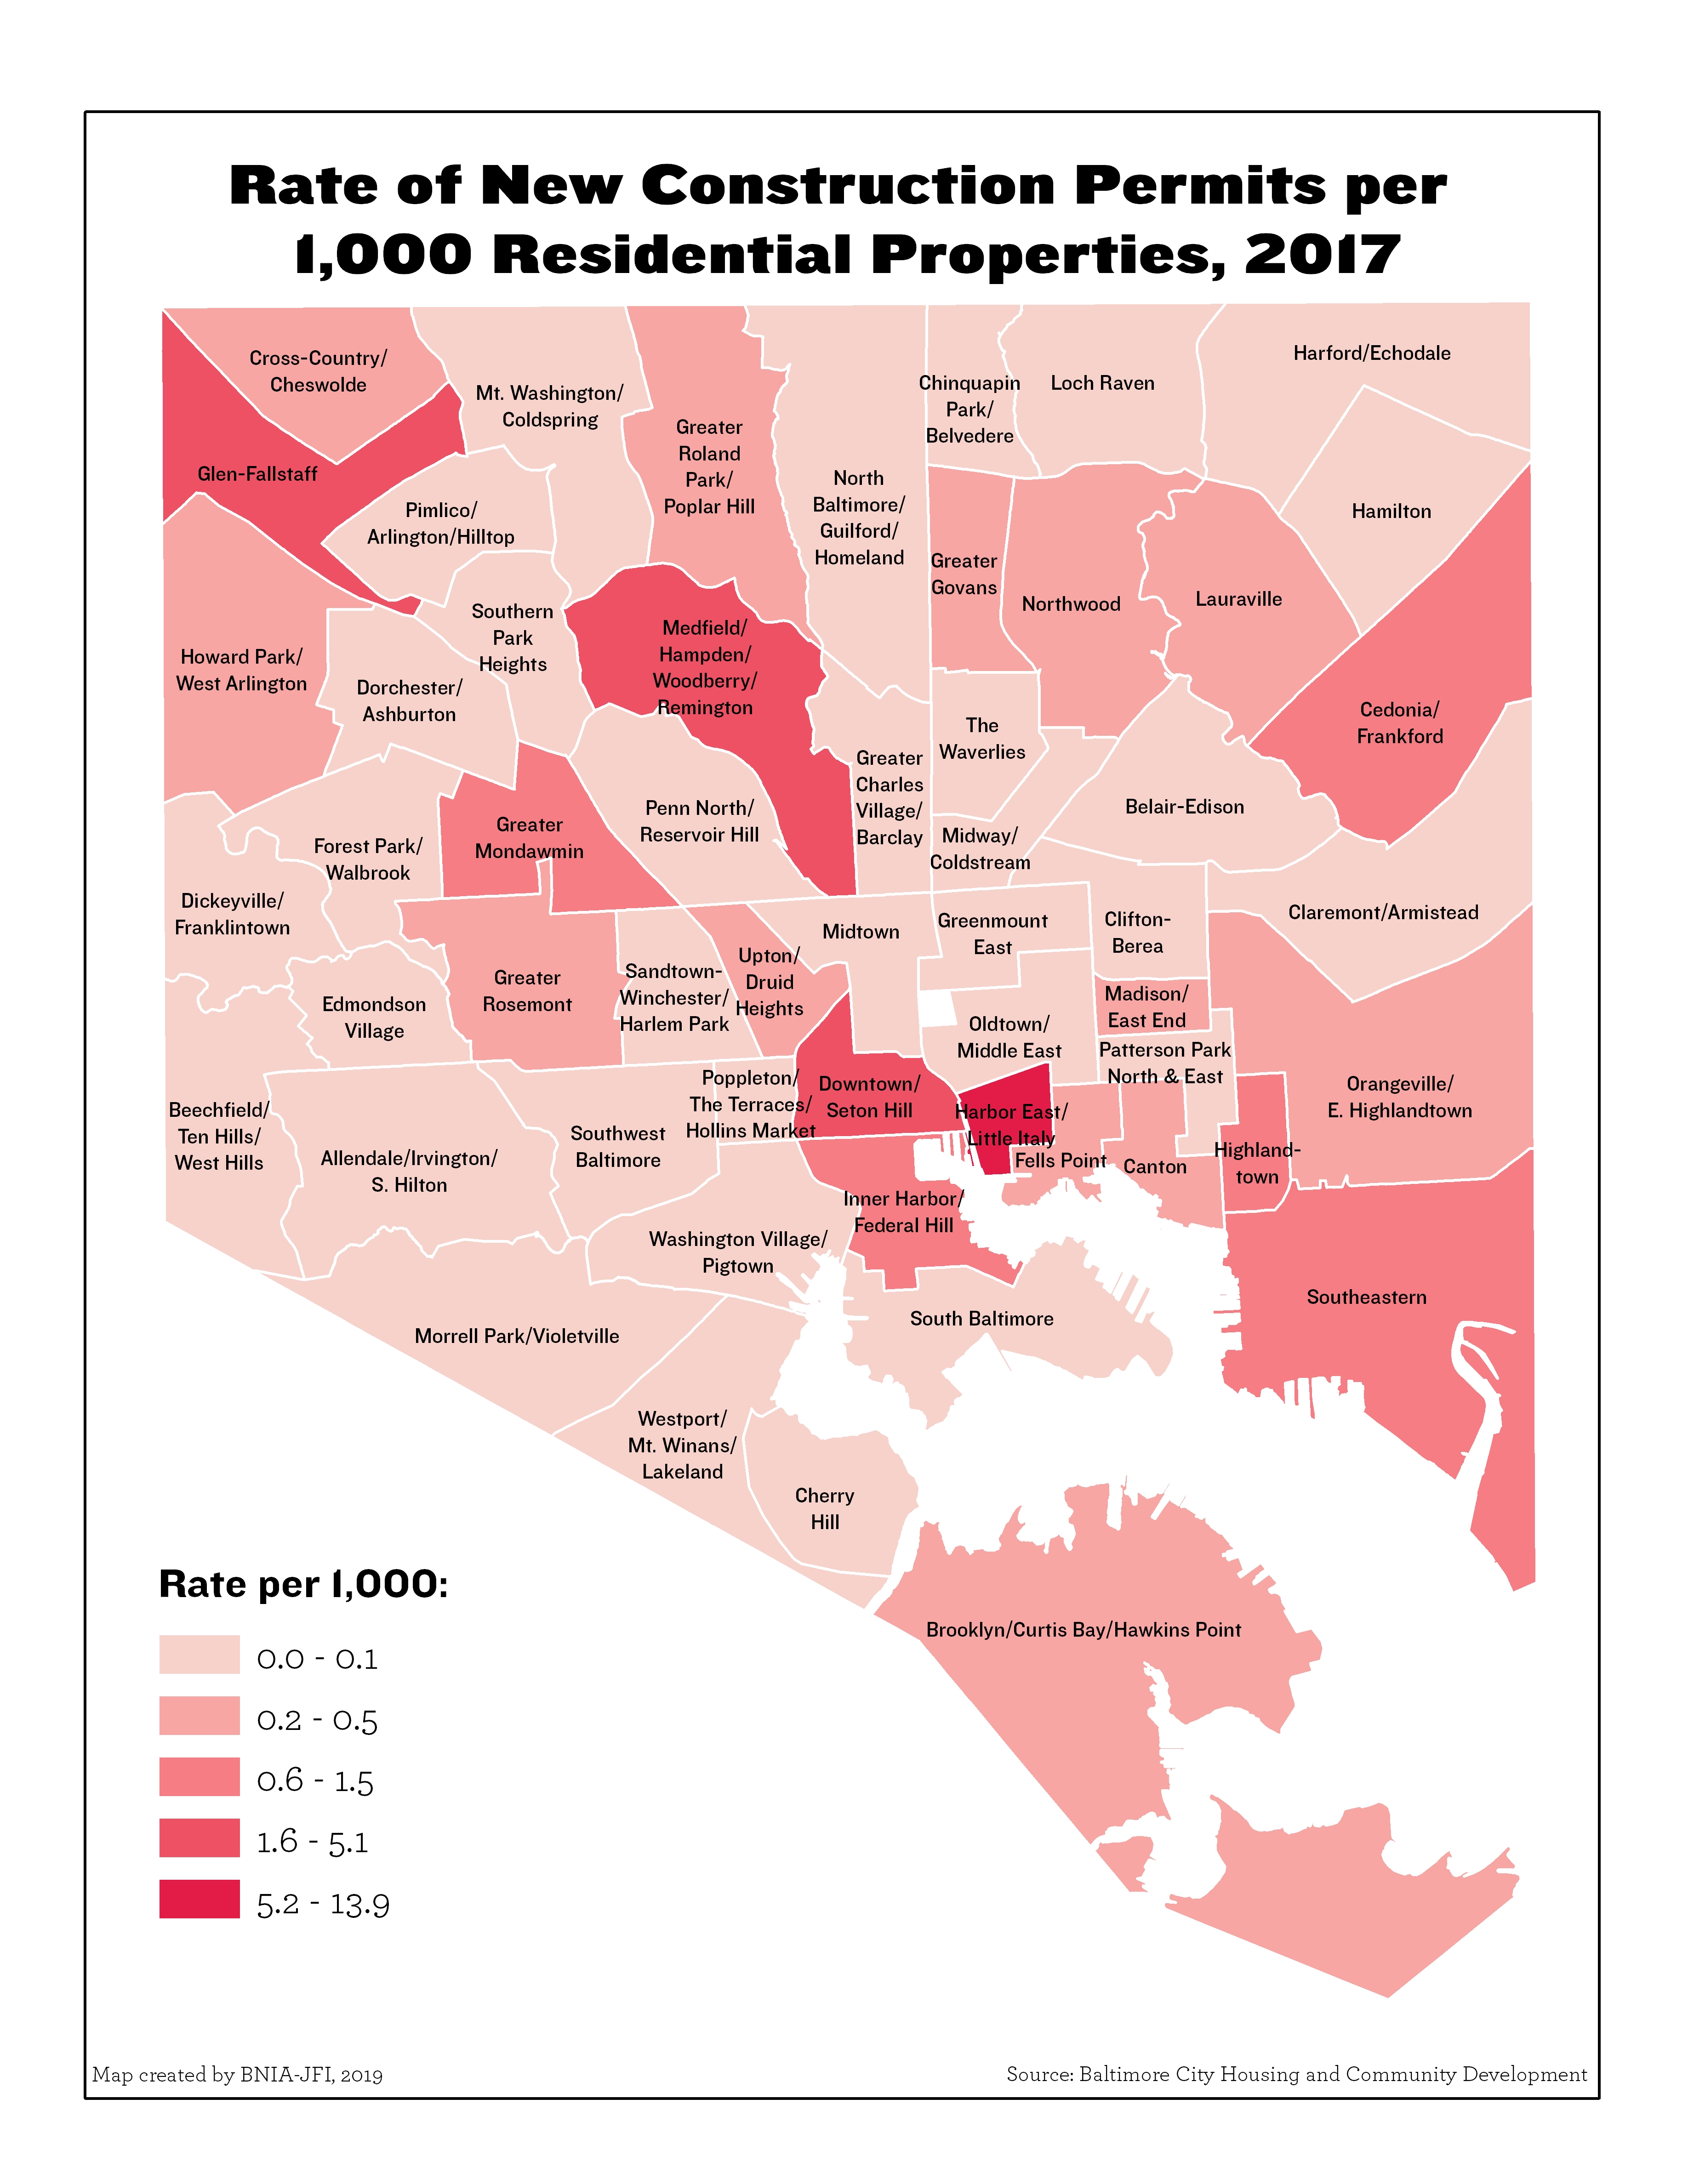
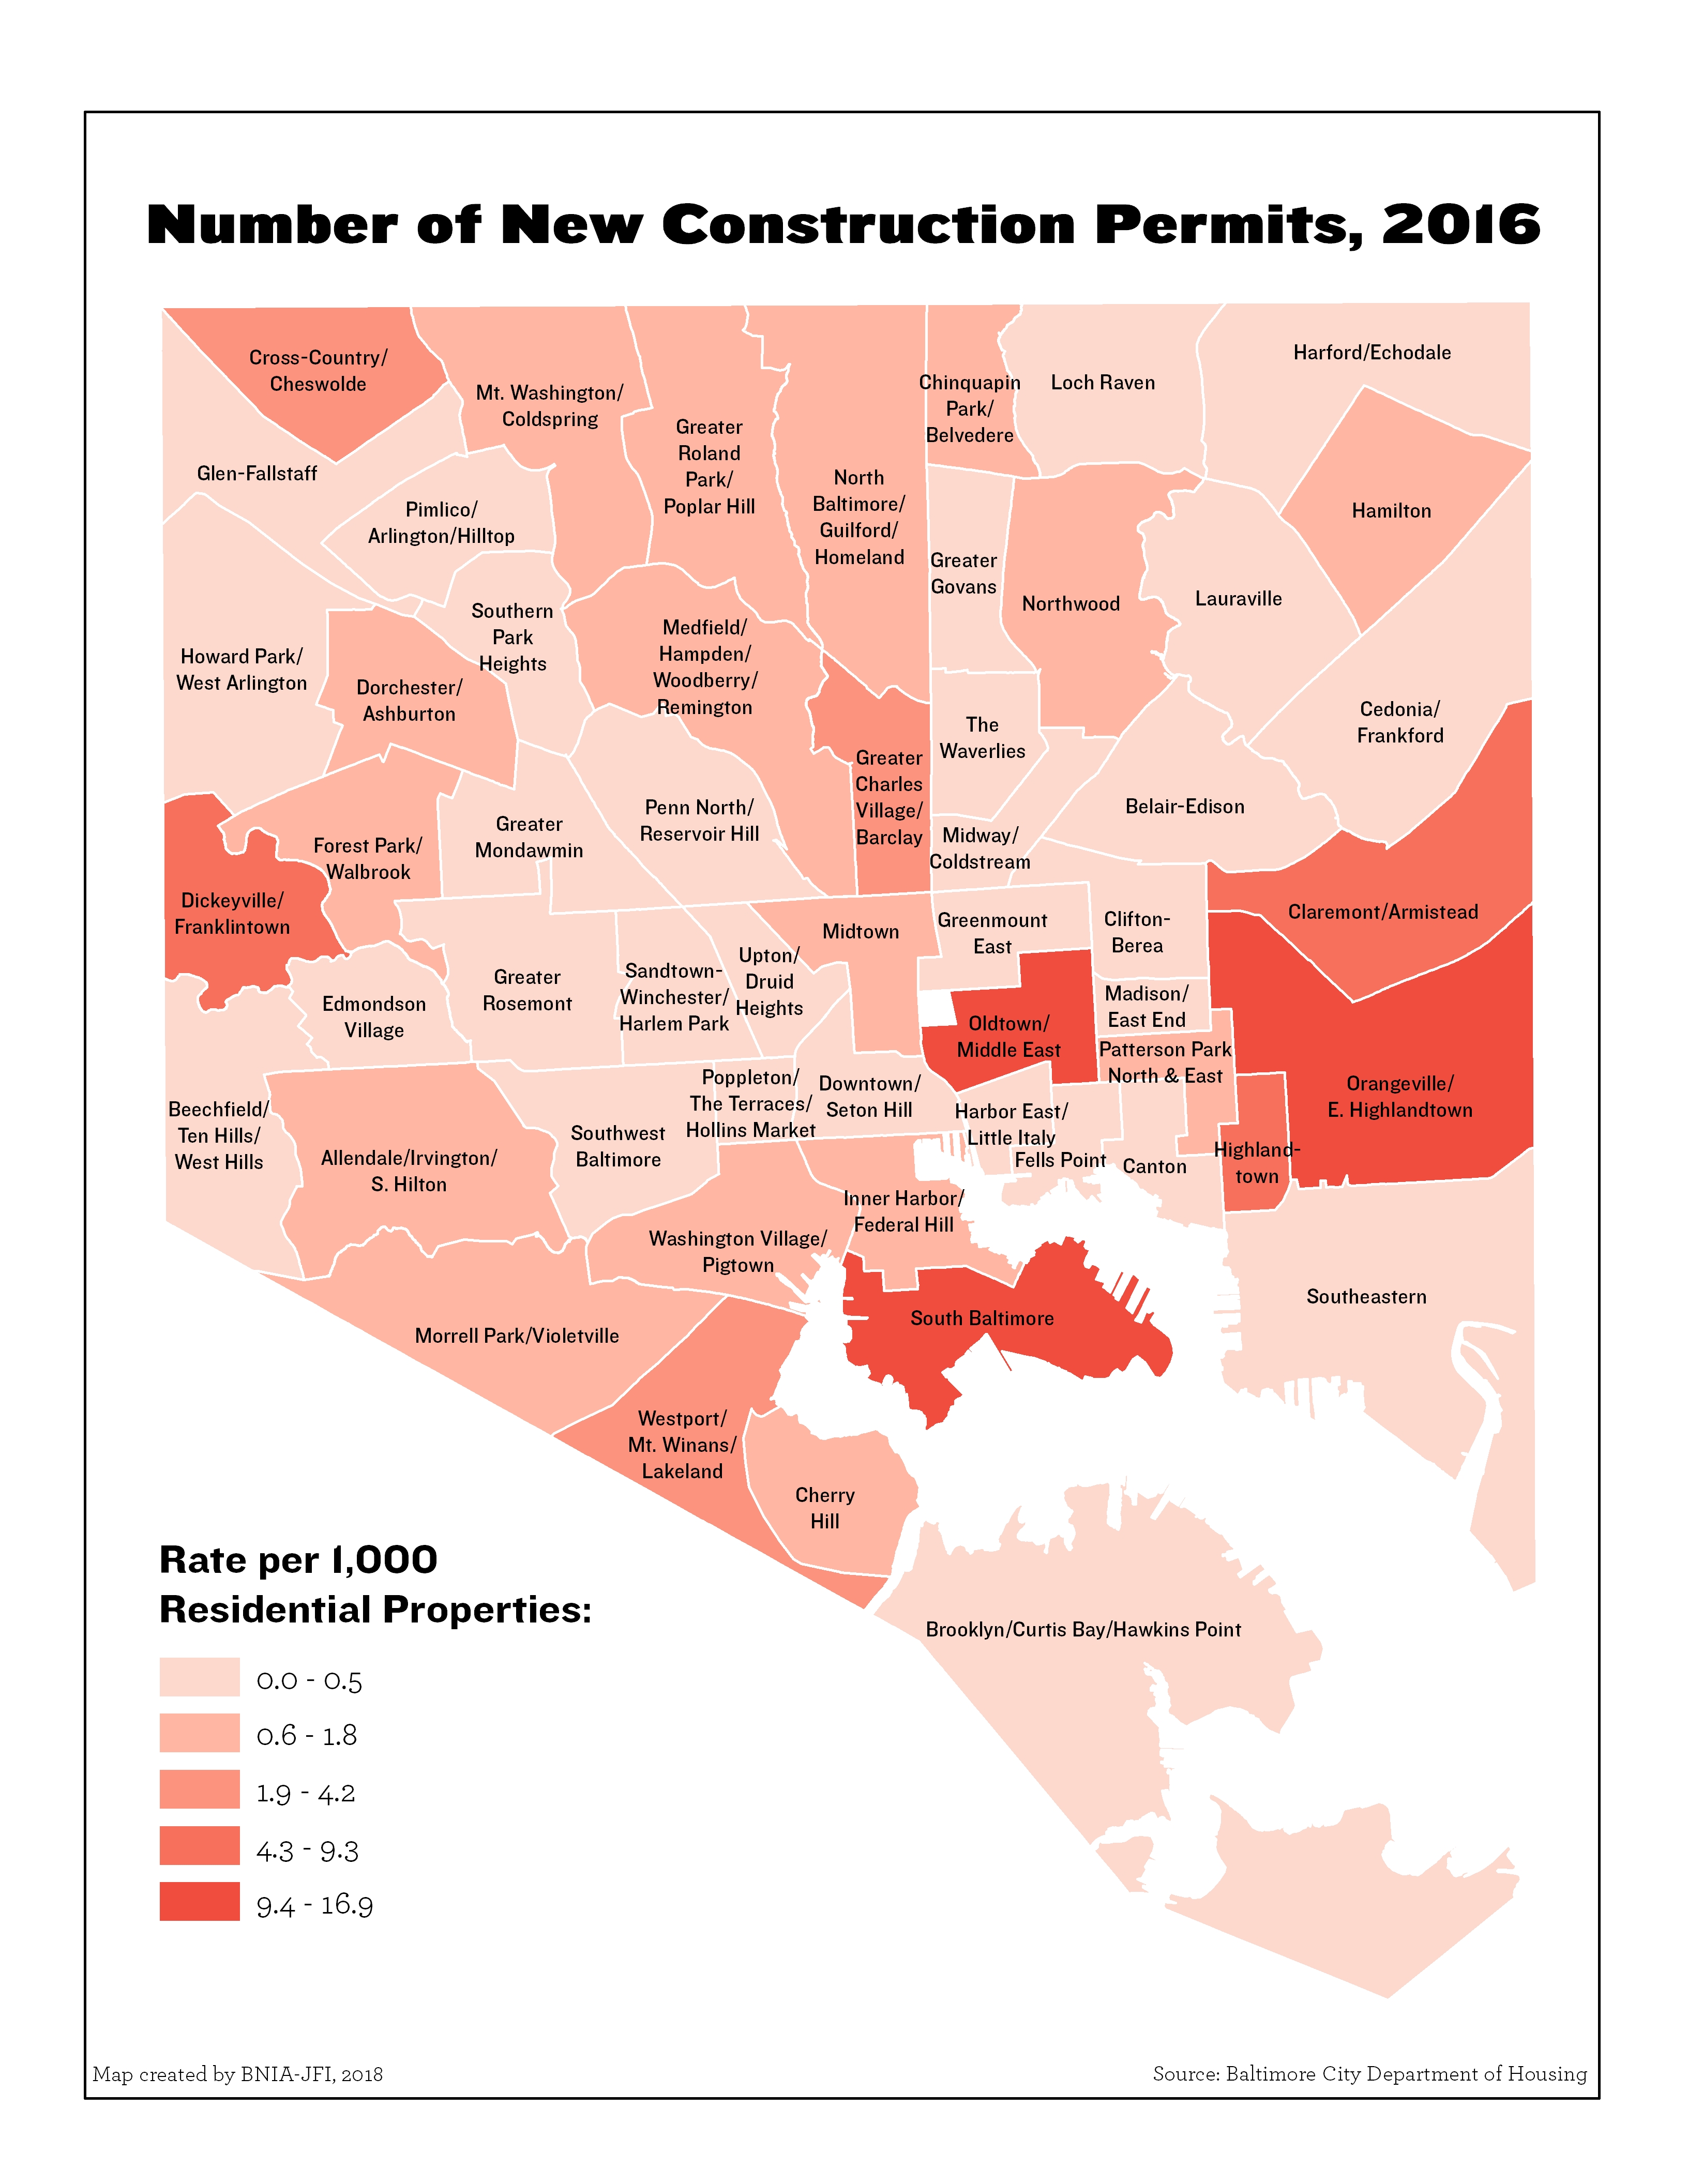
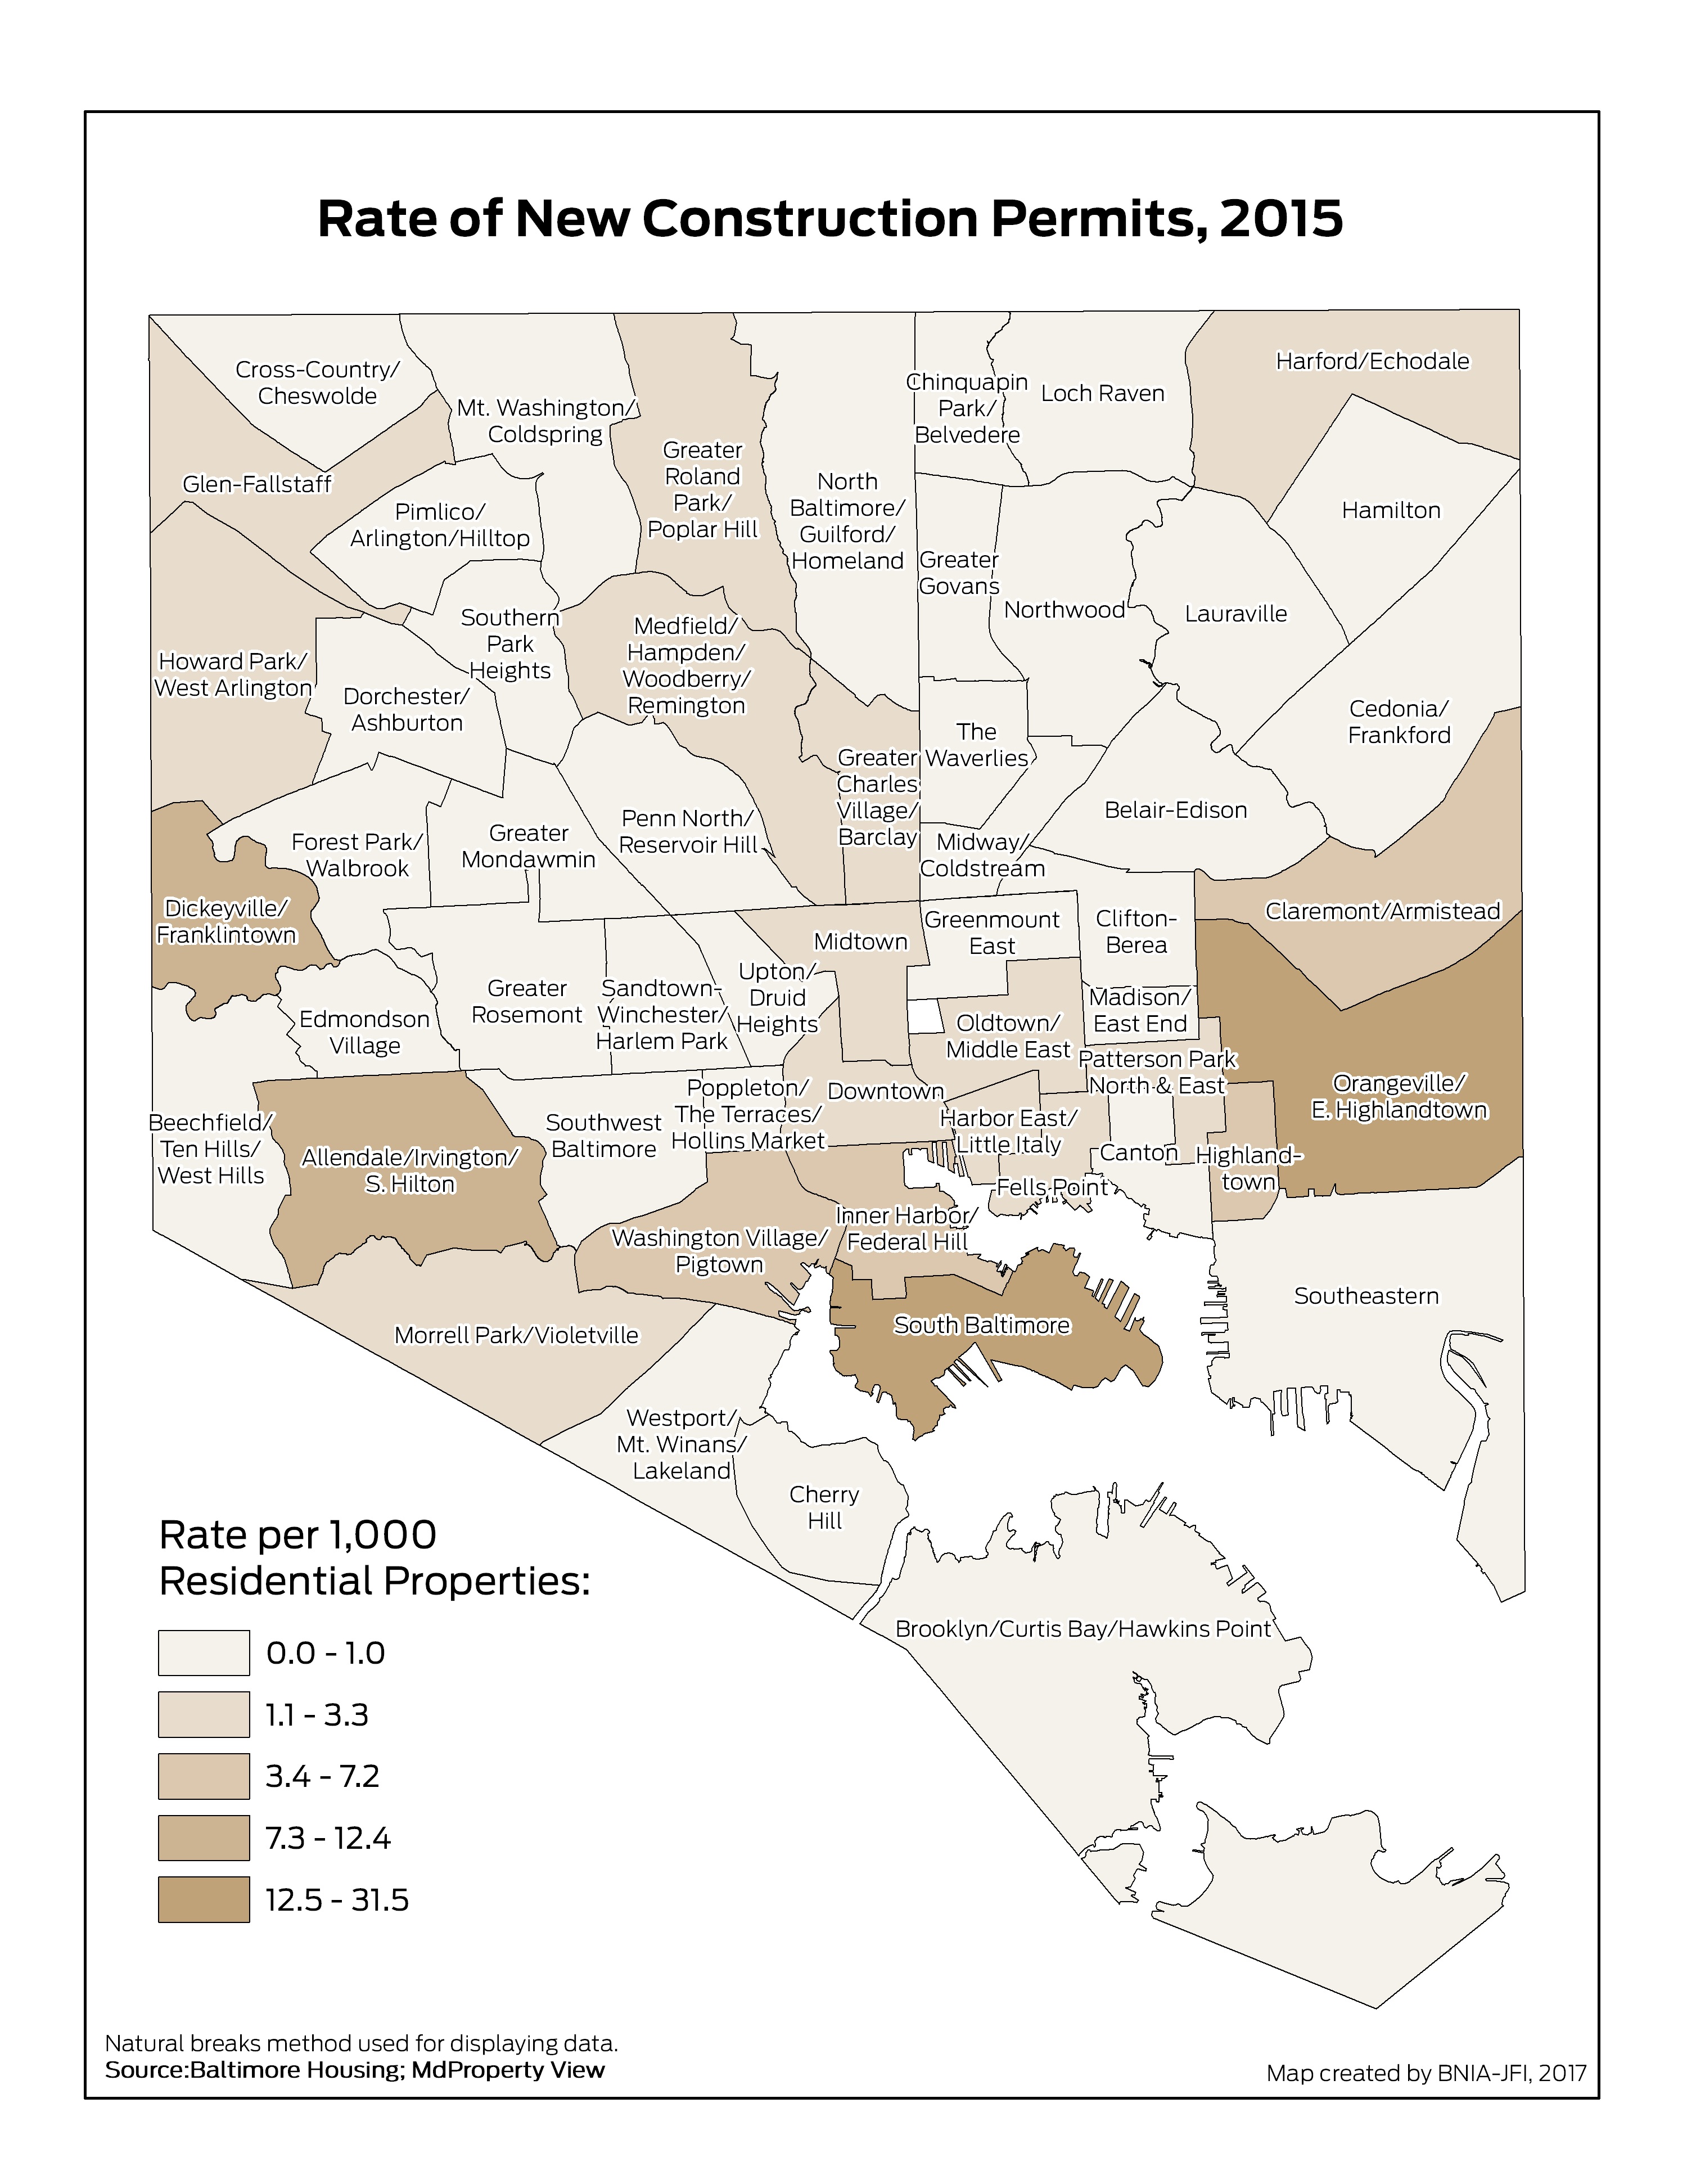
Number of New Construction Permits per 1,000 Residential Properties (2020)
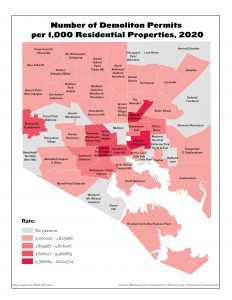
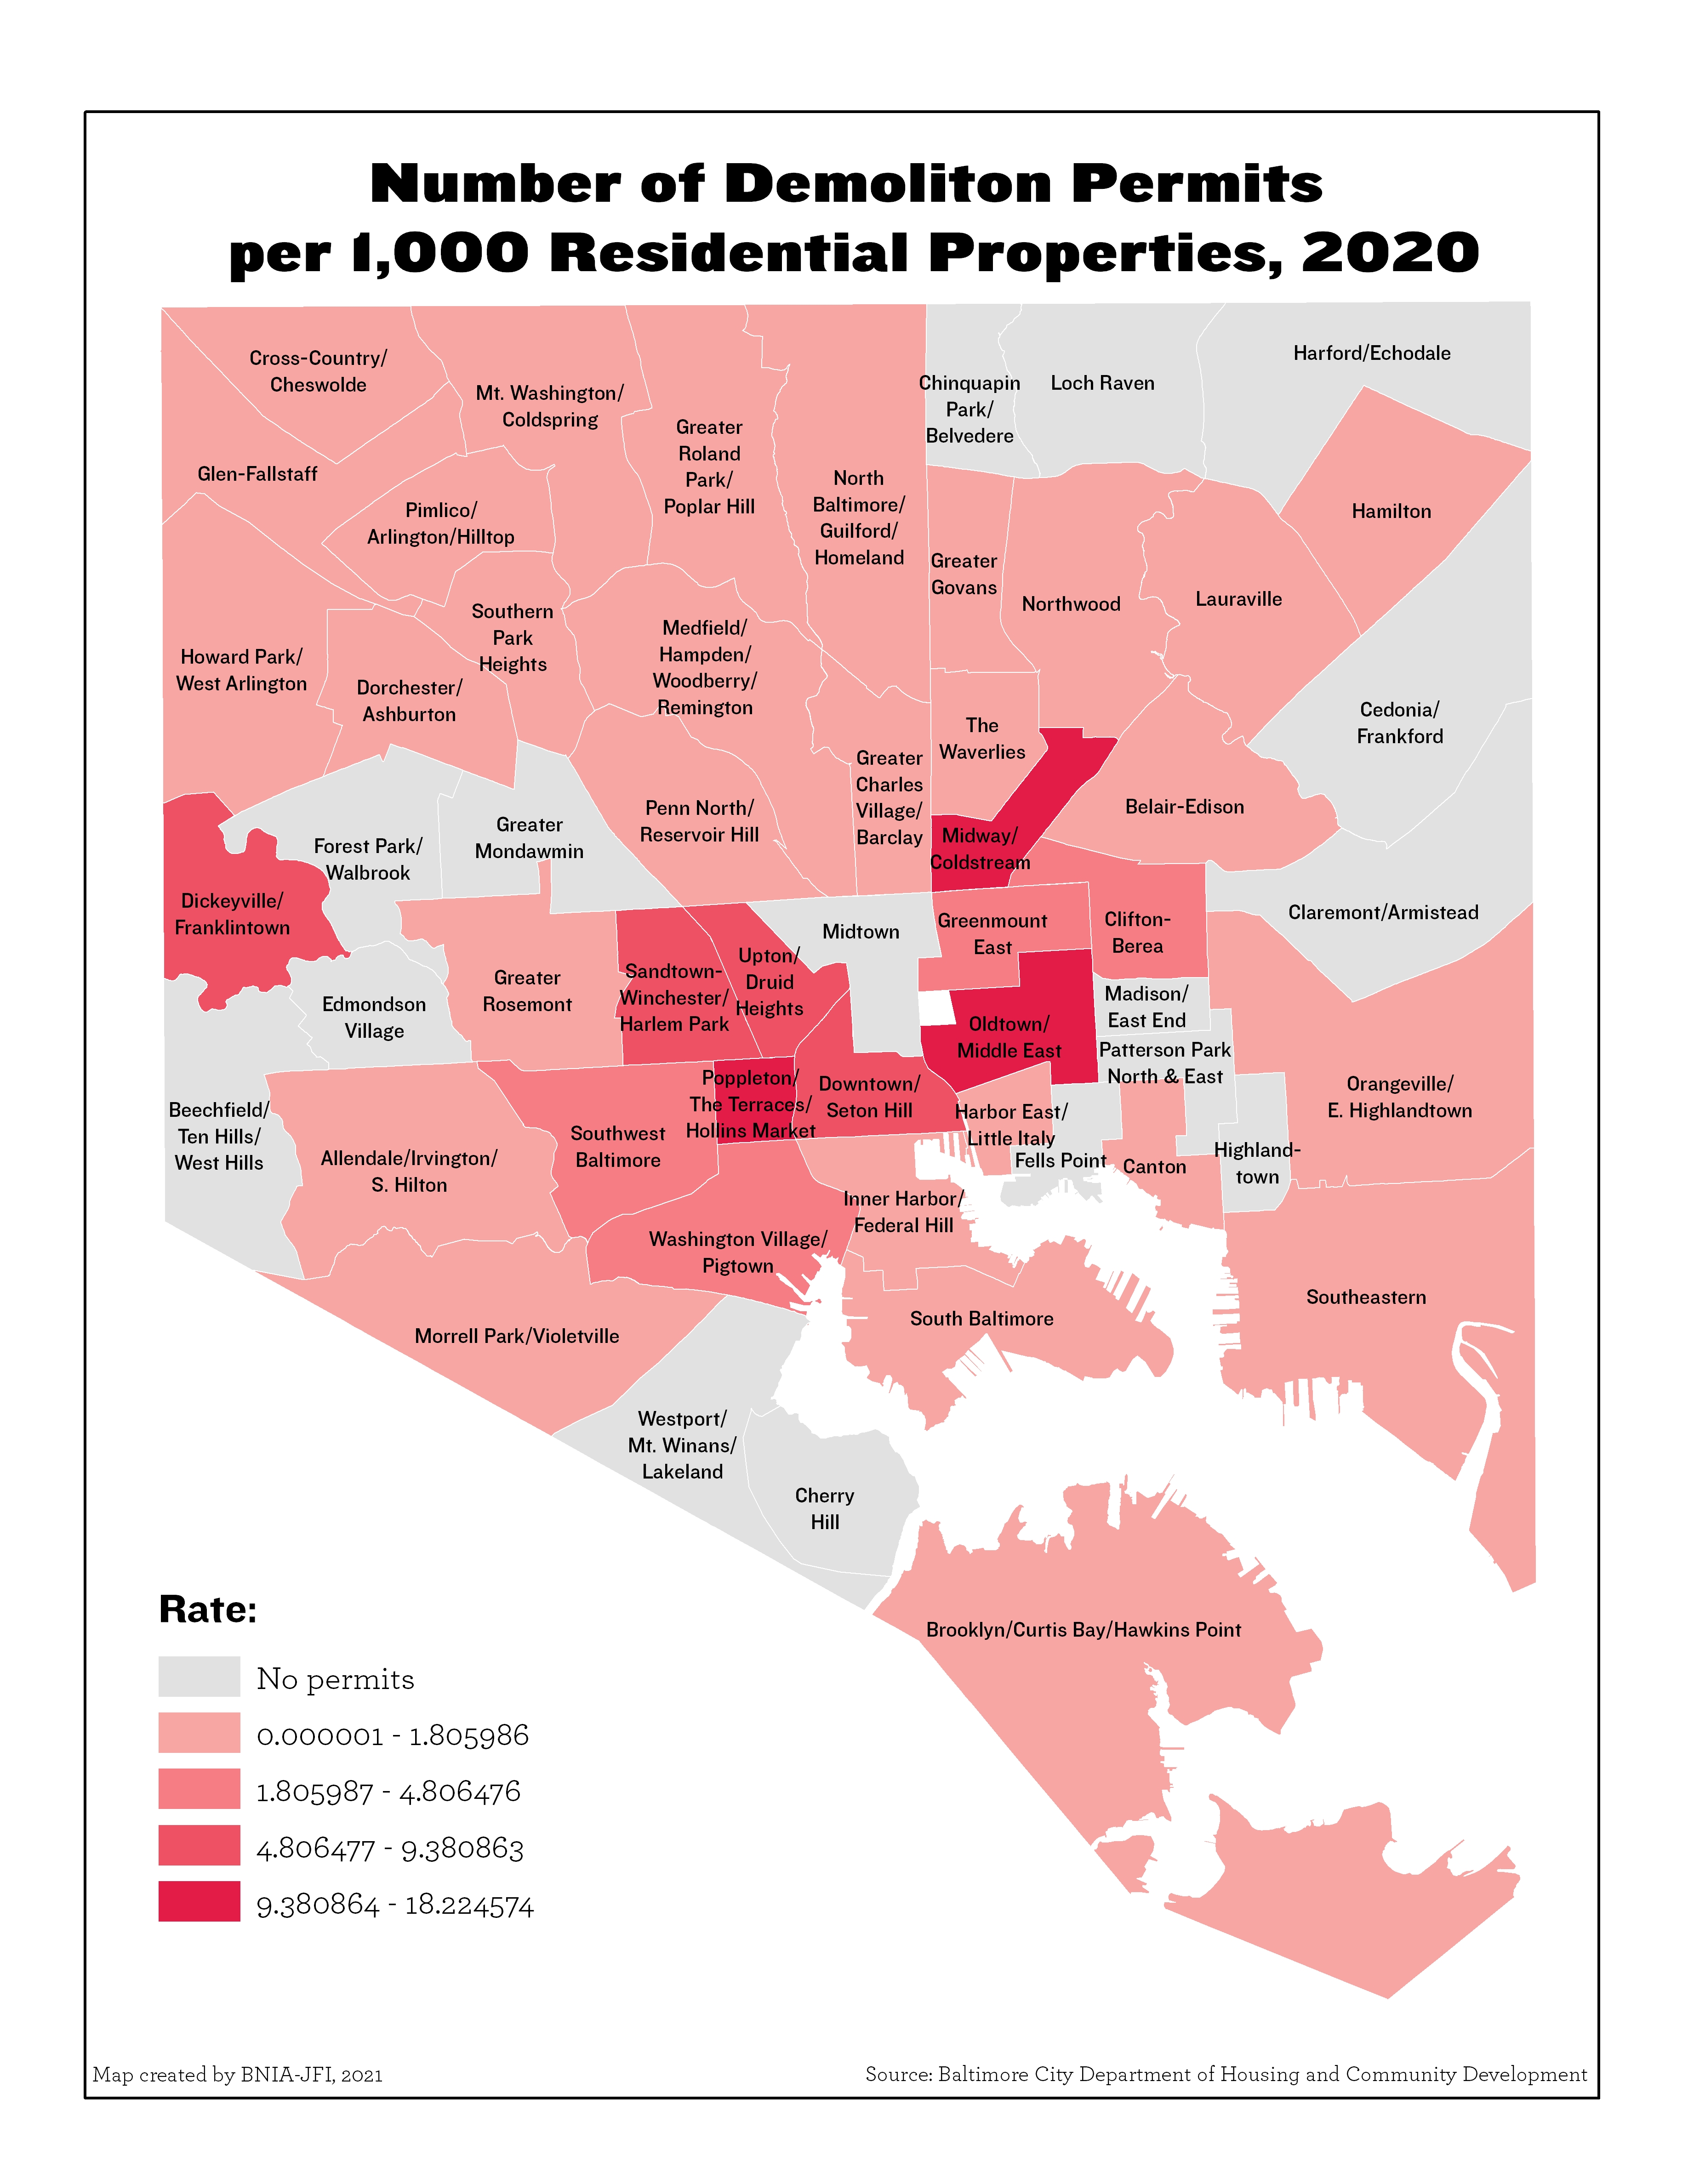
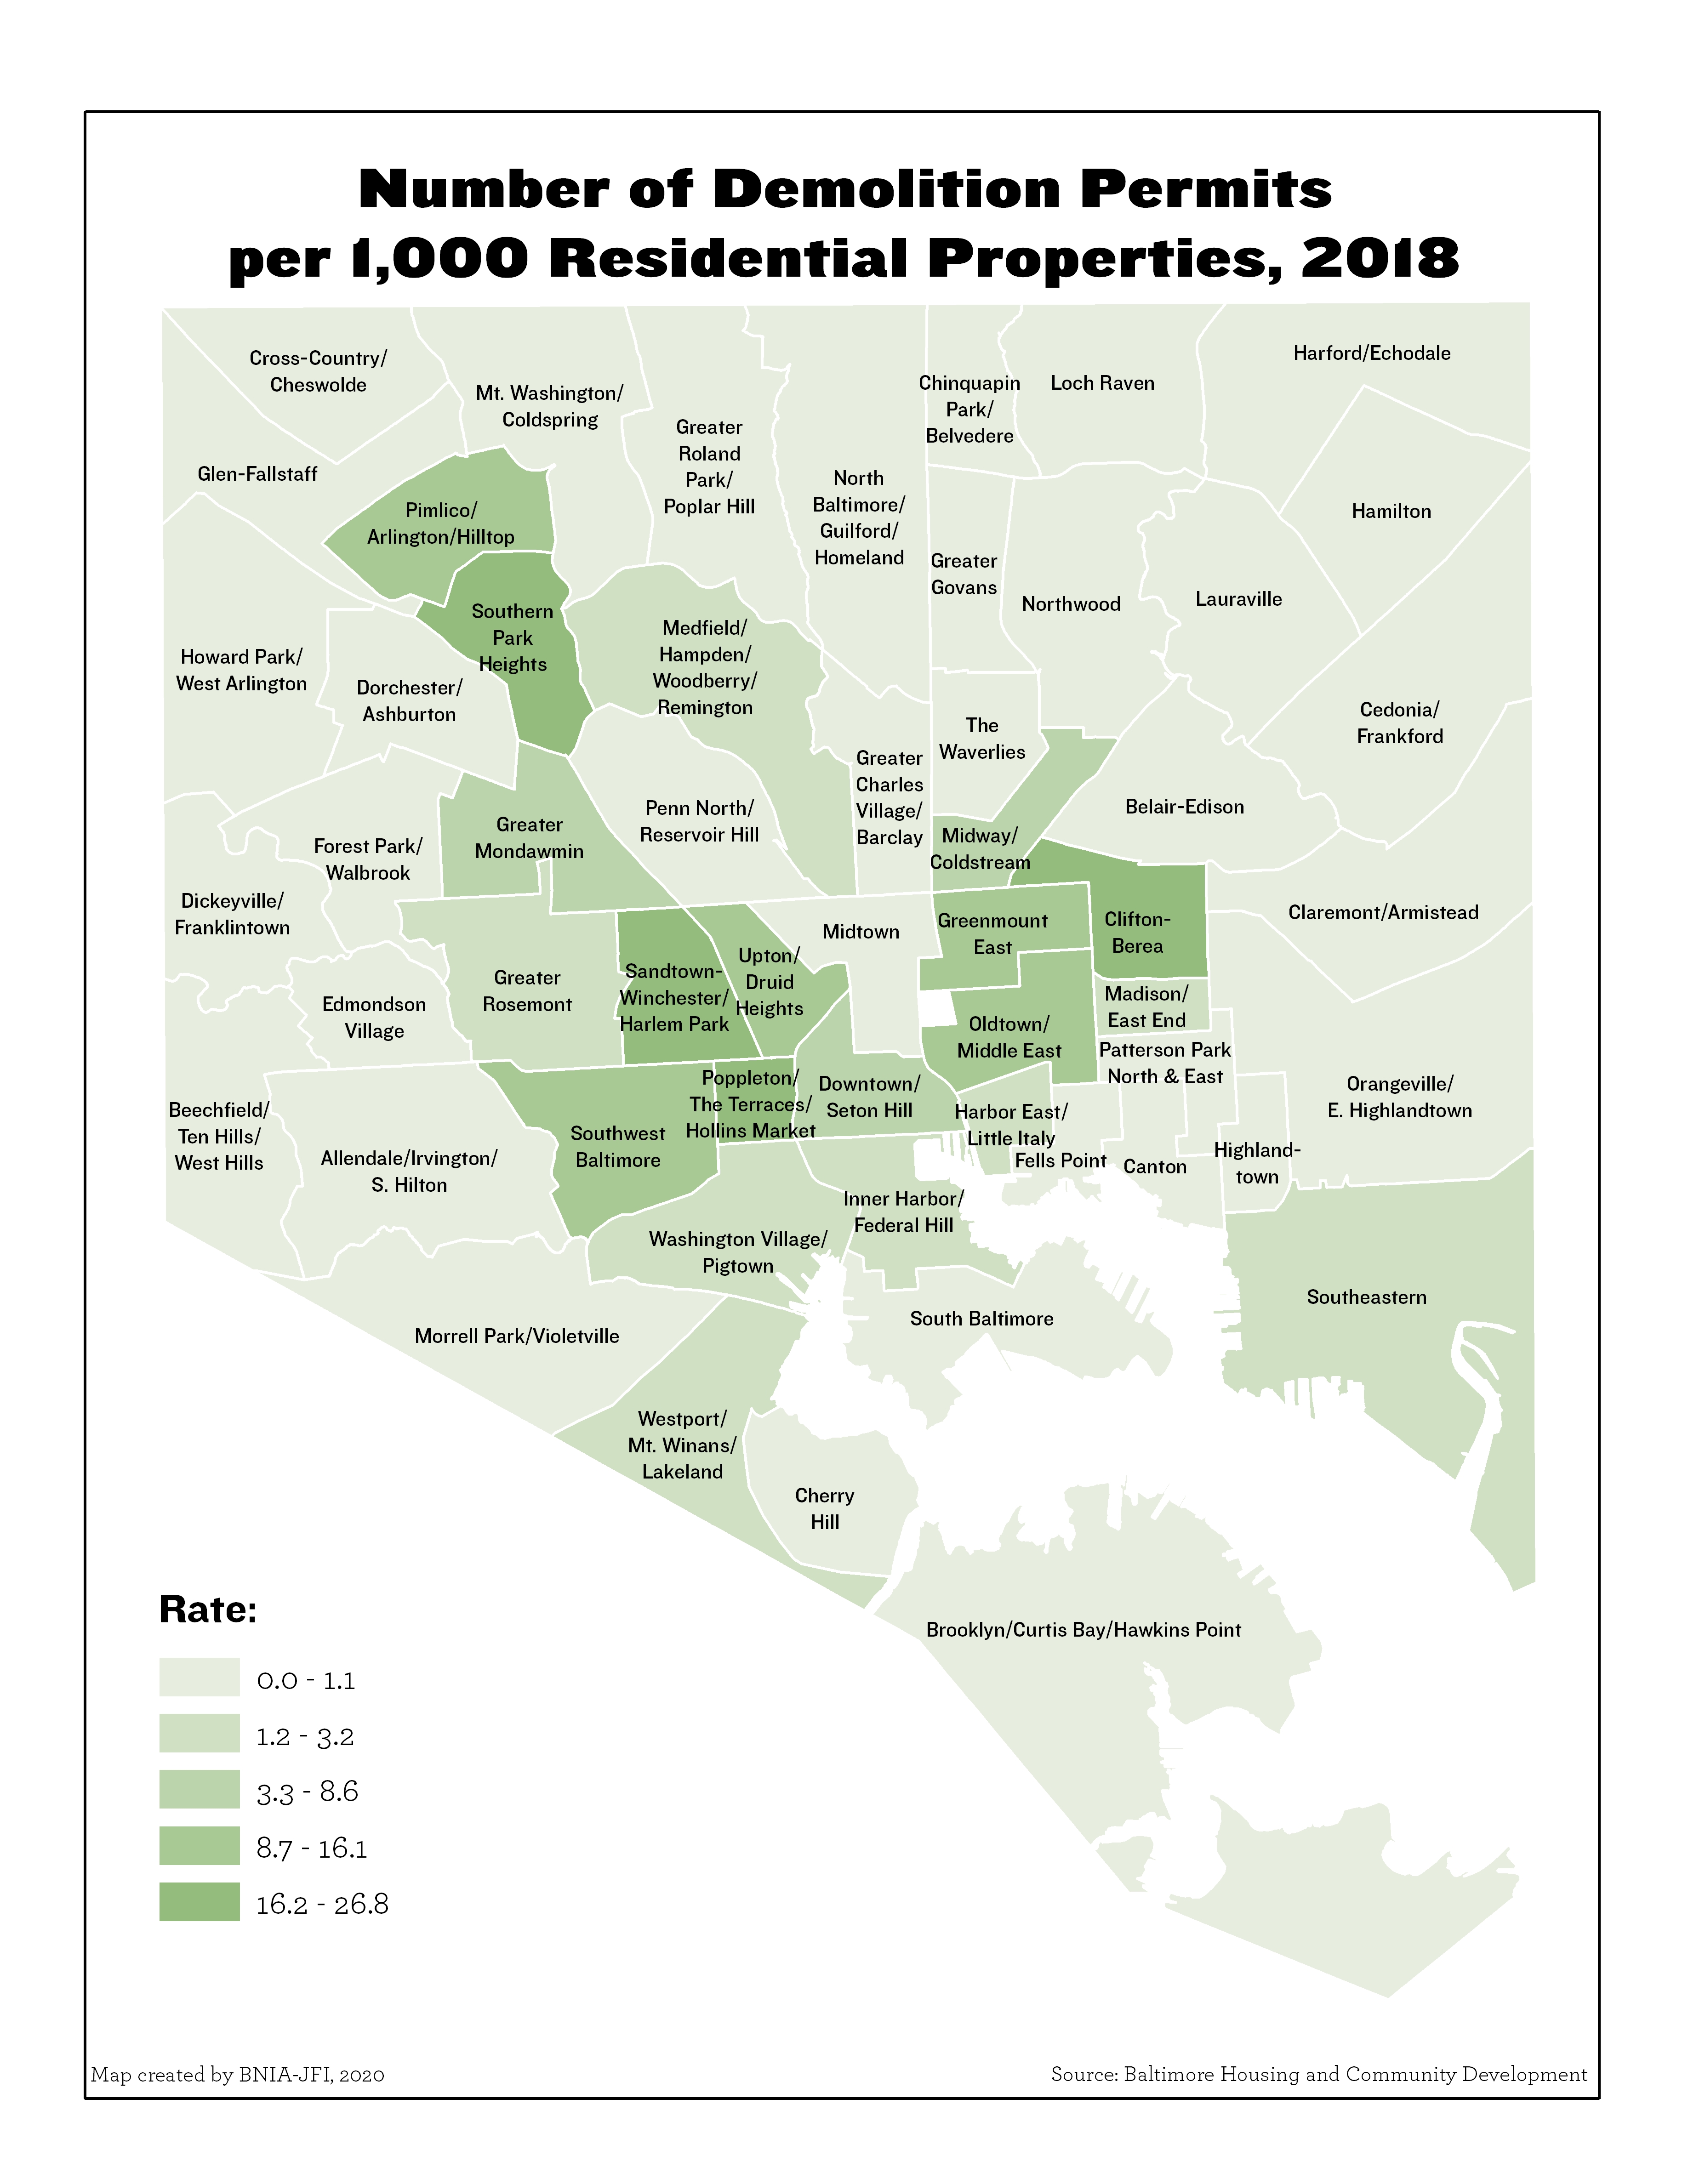
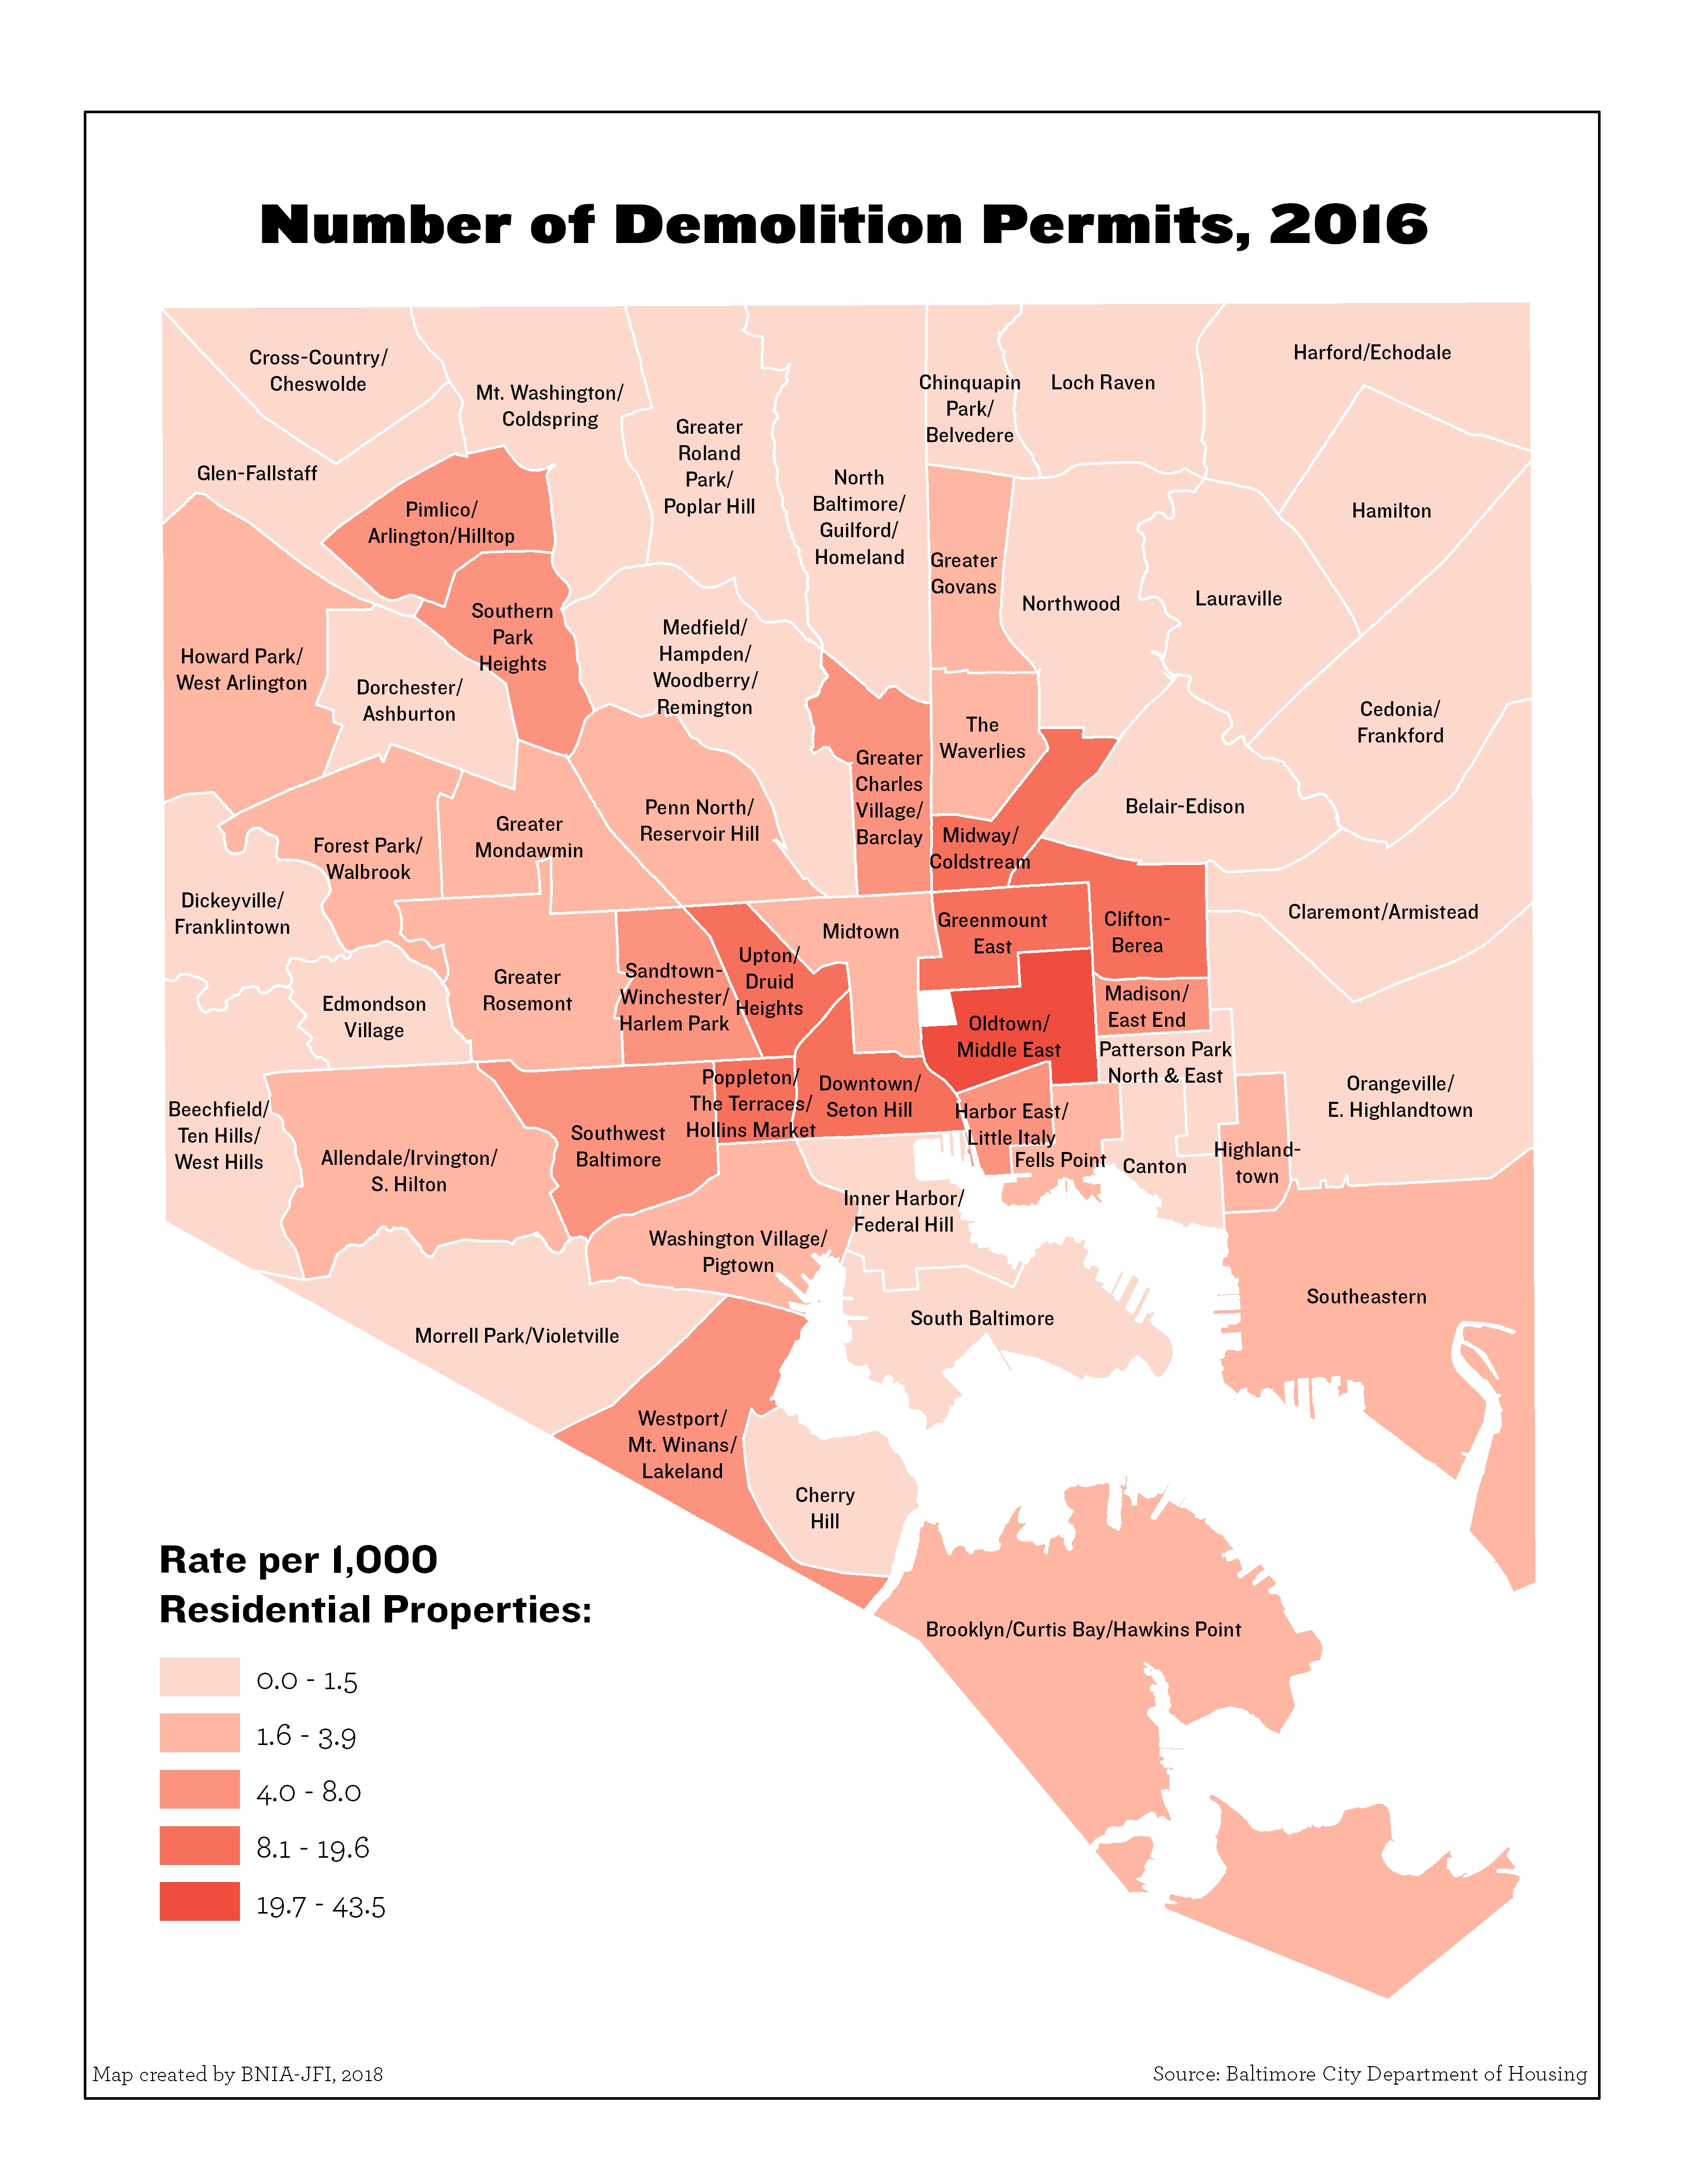
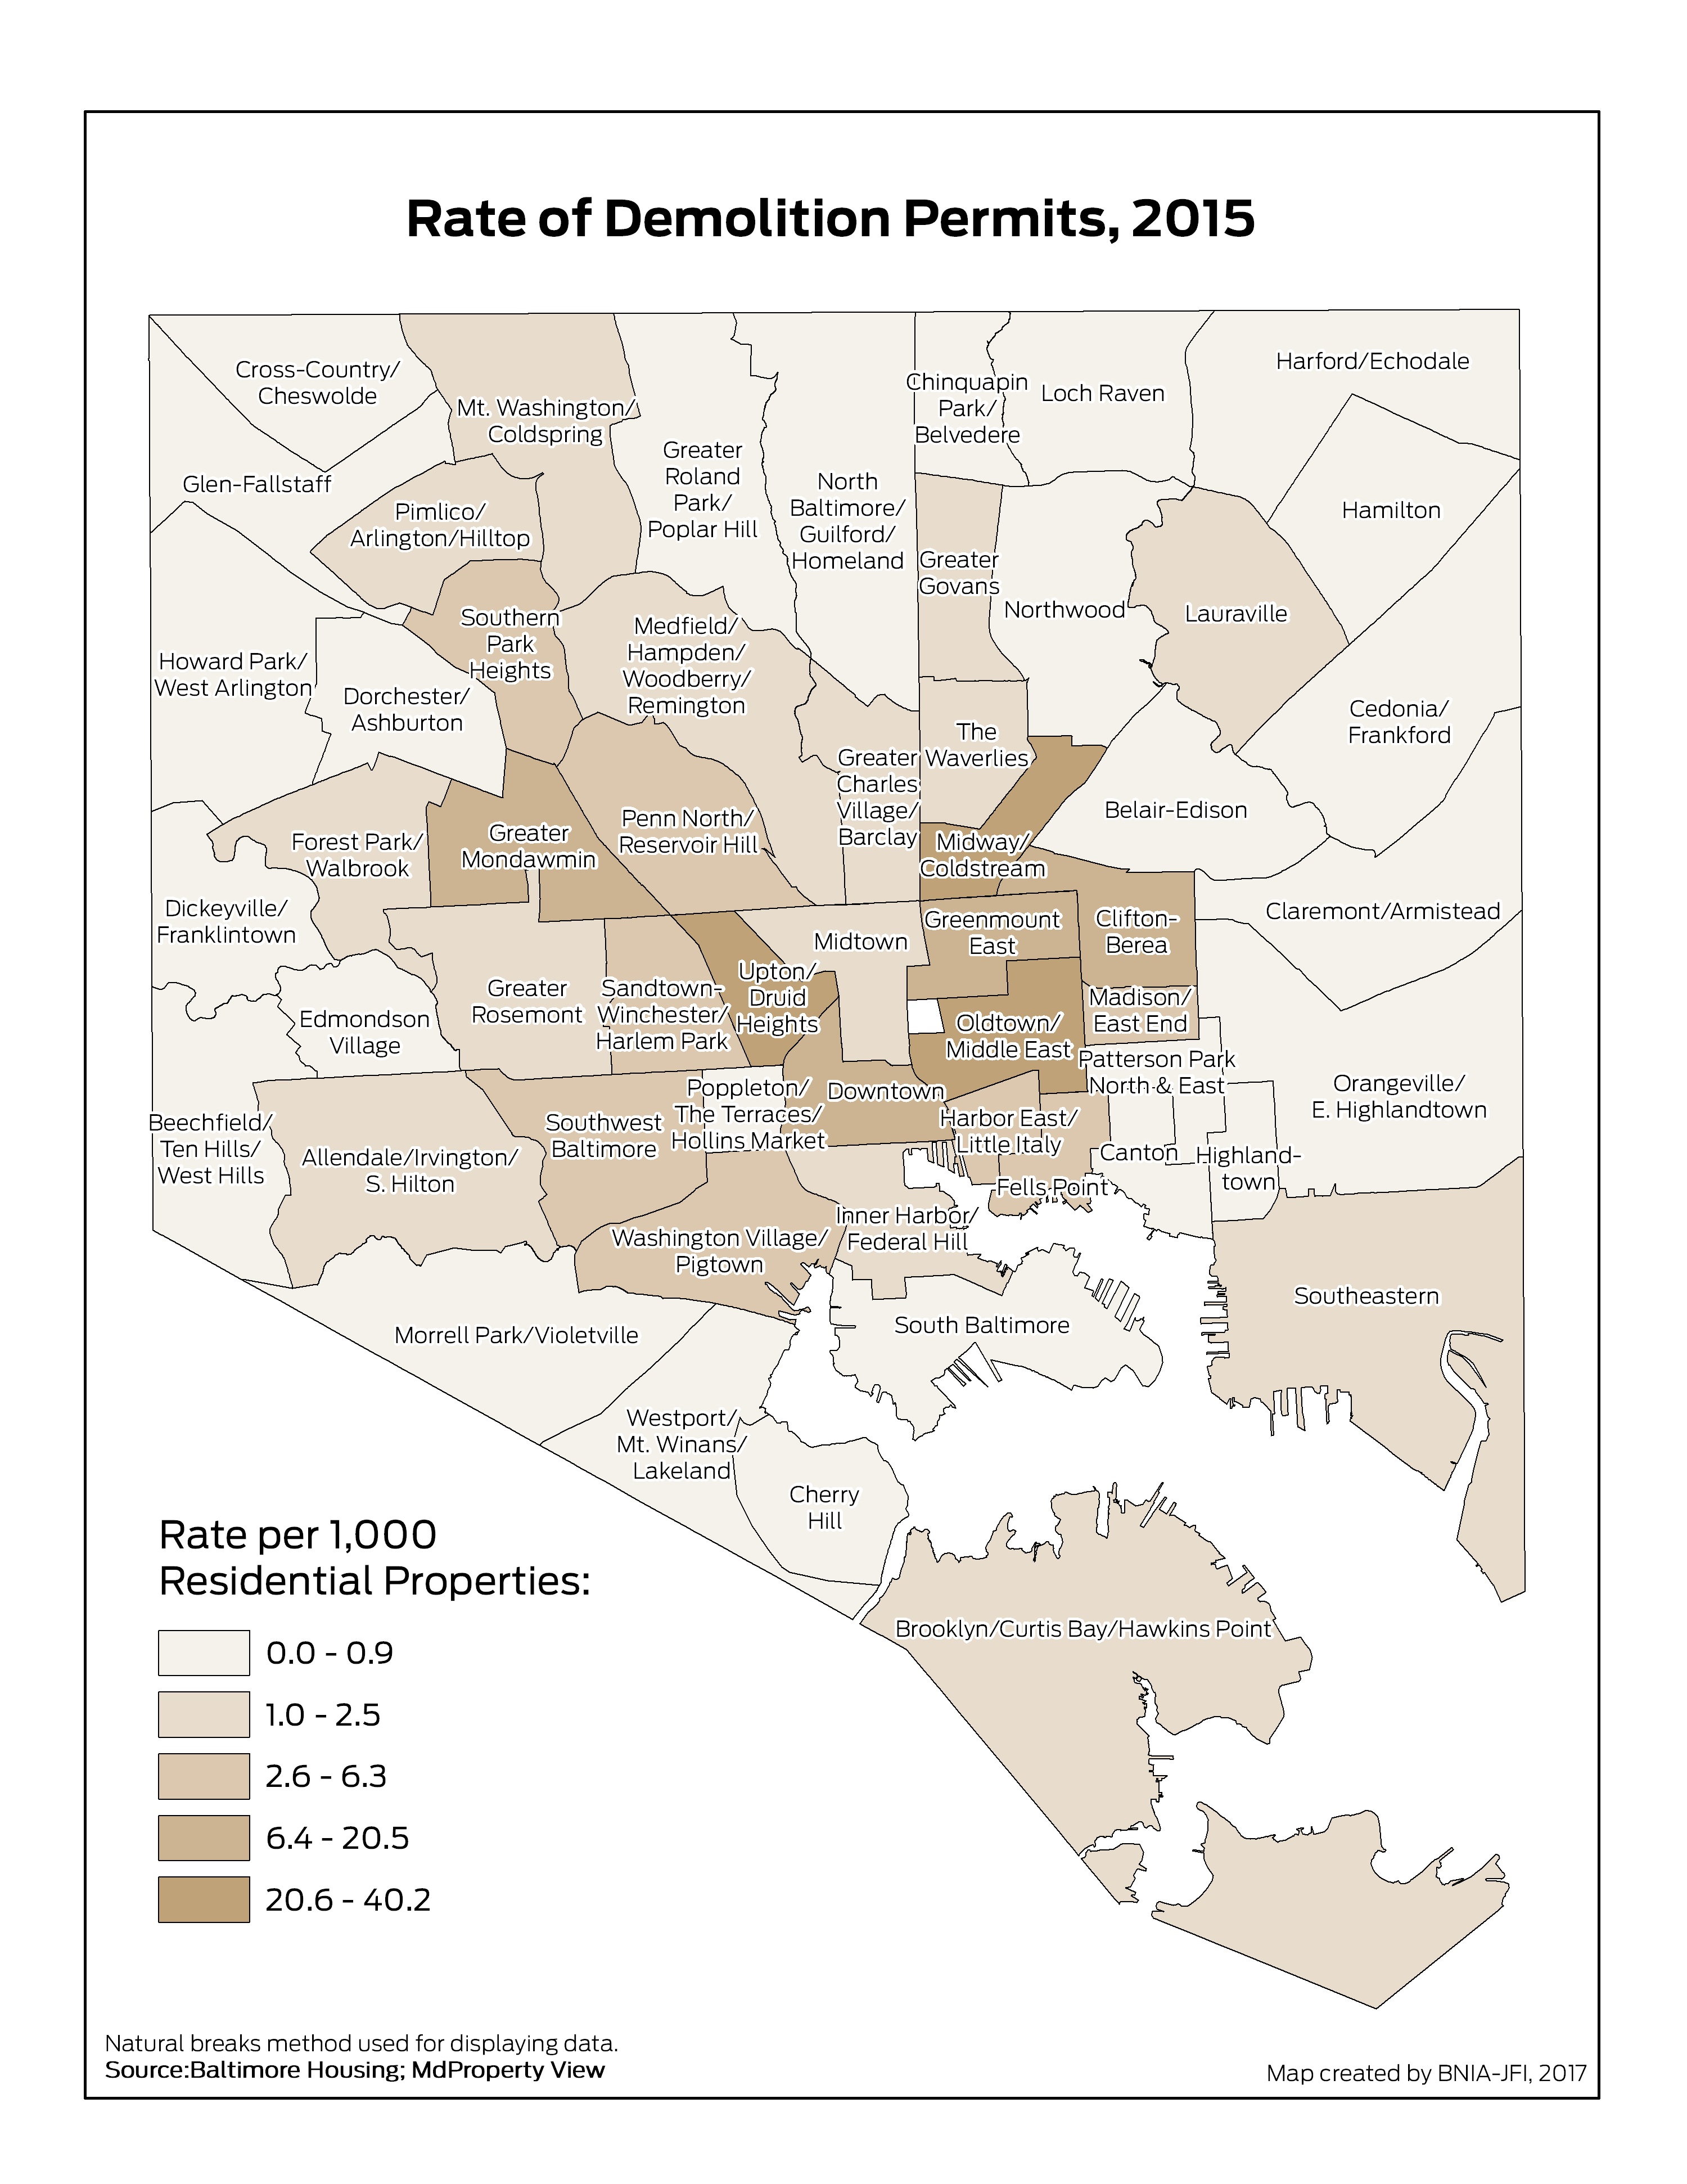
Number of Demolition Permits per 1,000 Residential Properties (2020)
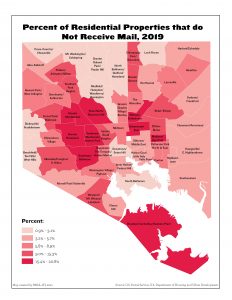
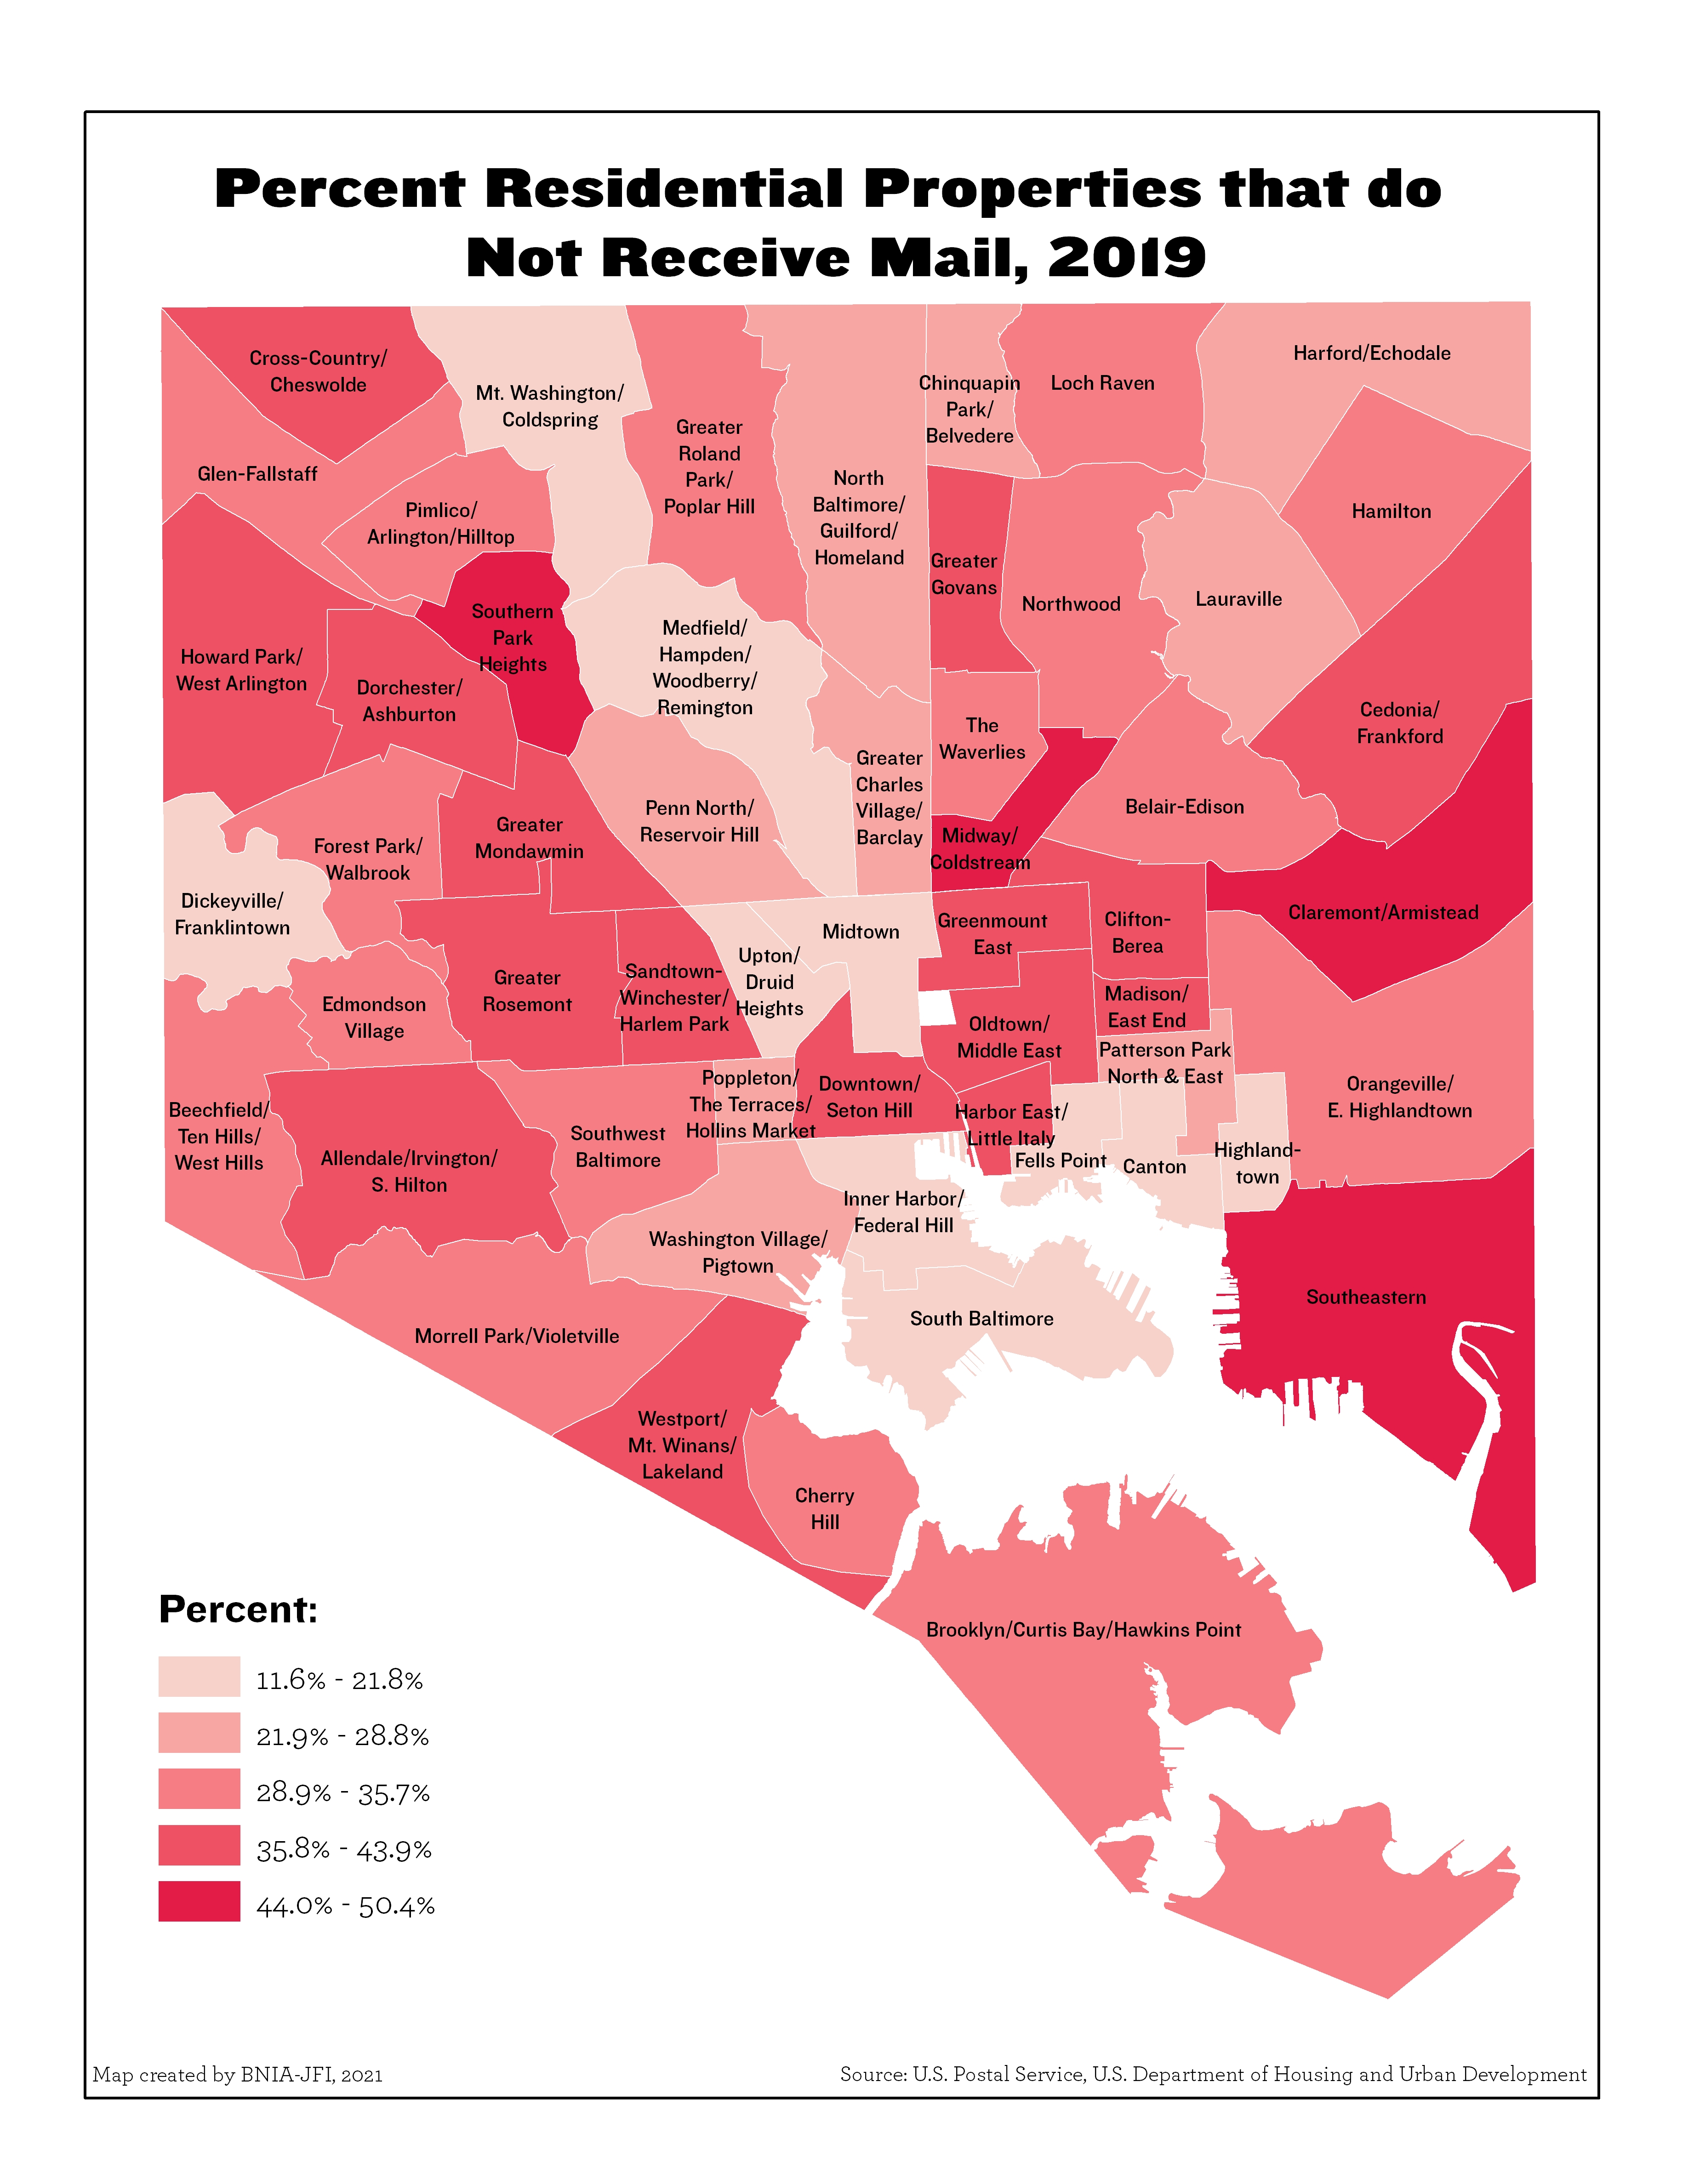
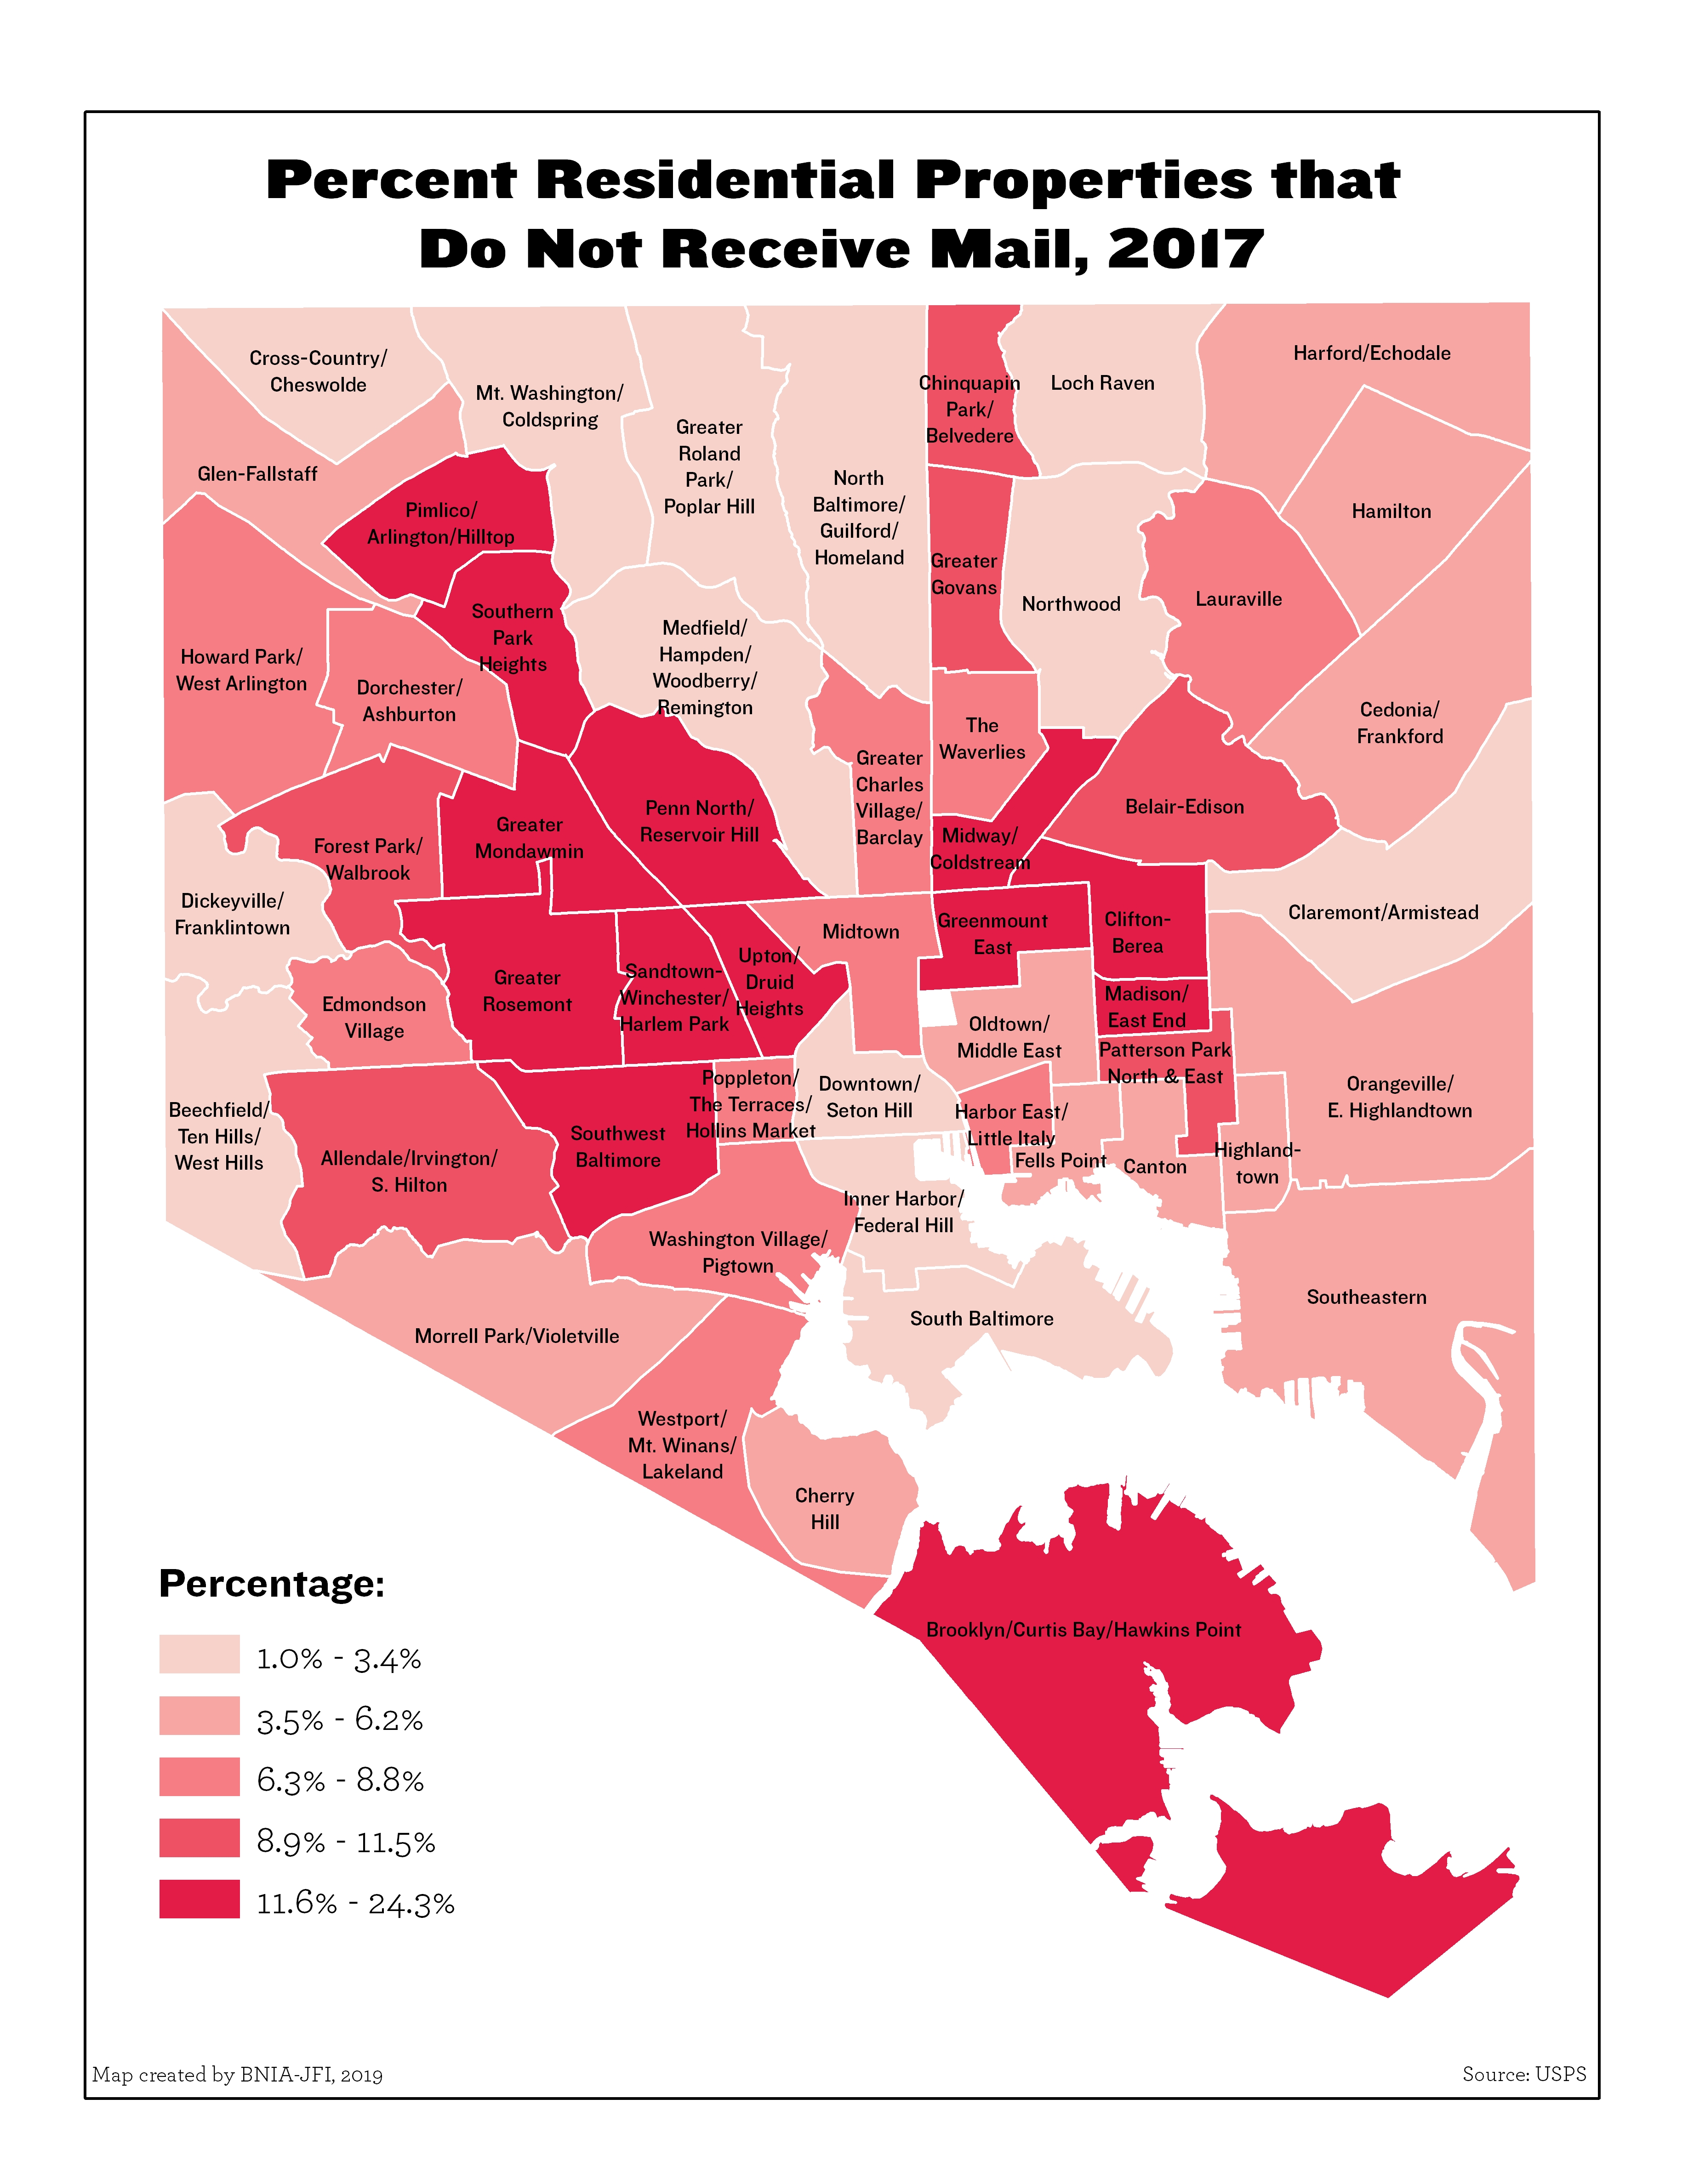
Percent of Residential Properties that do Not Receive Mail (2019)
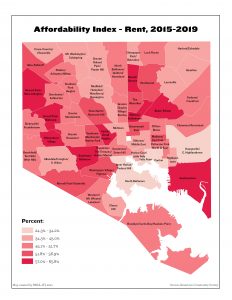
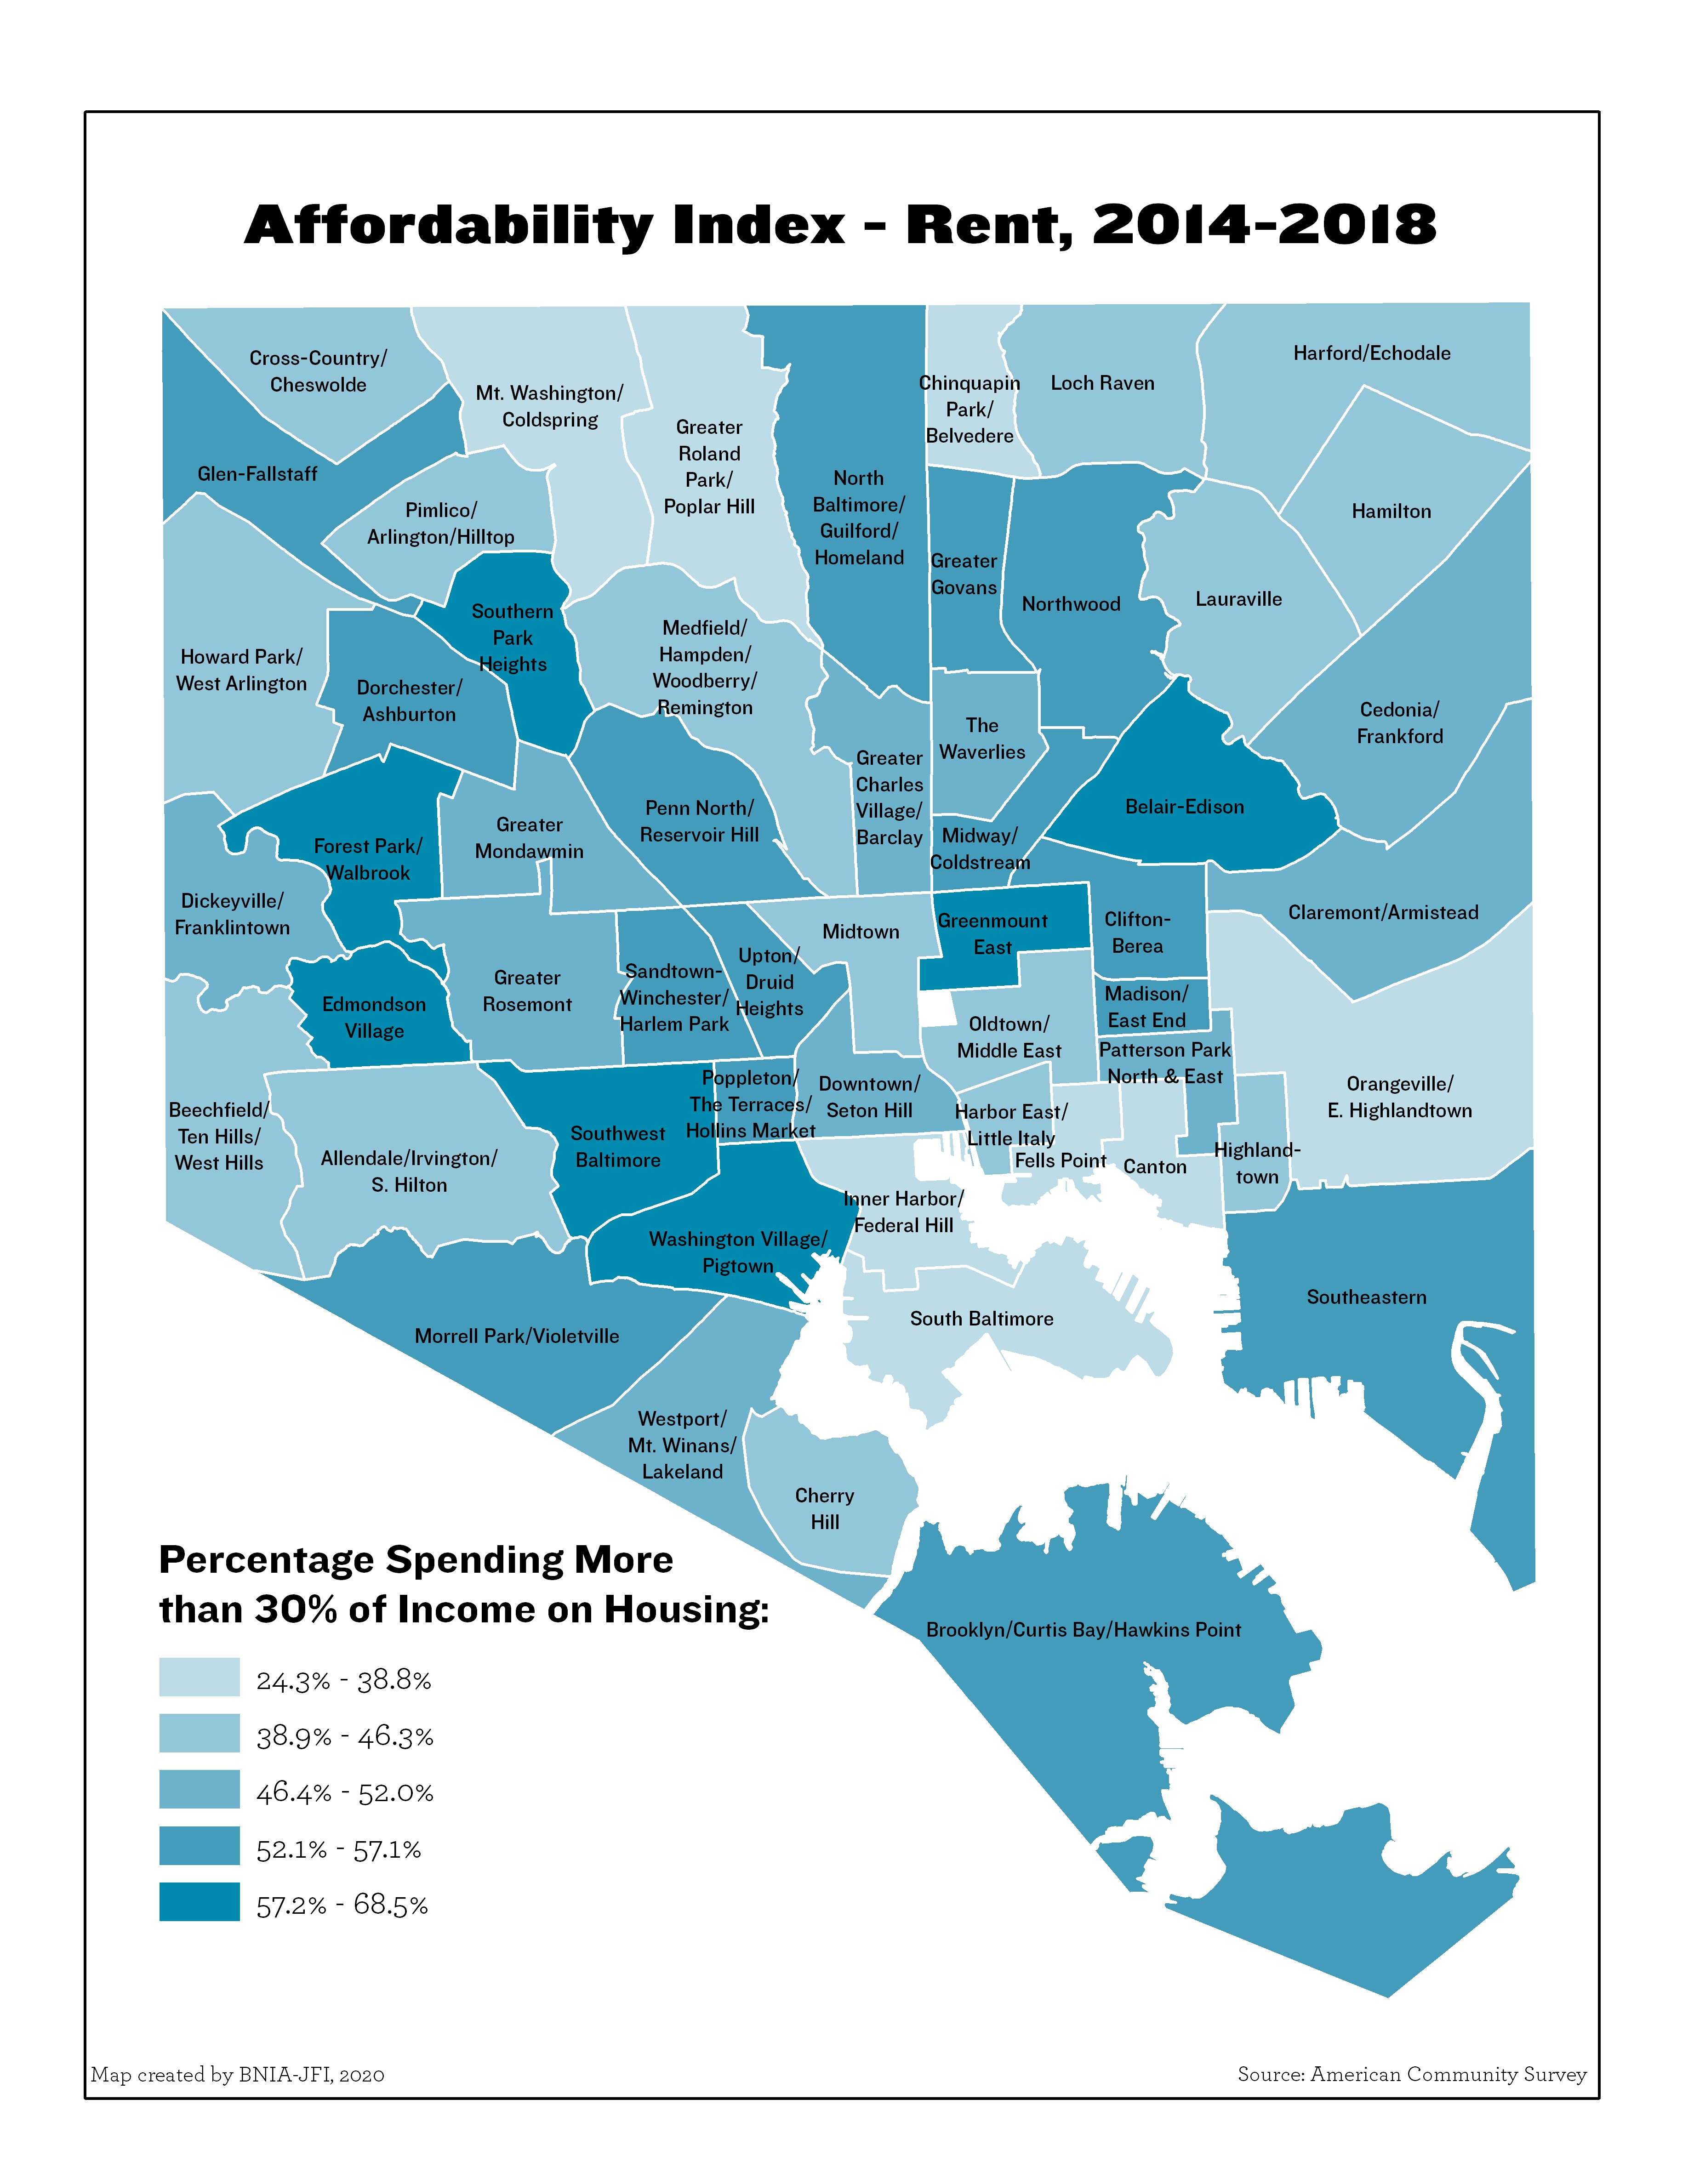
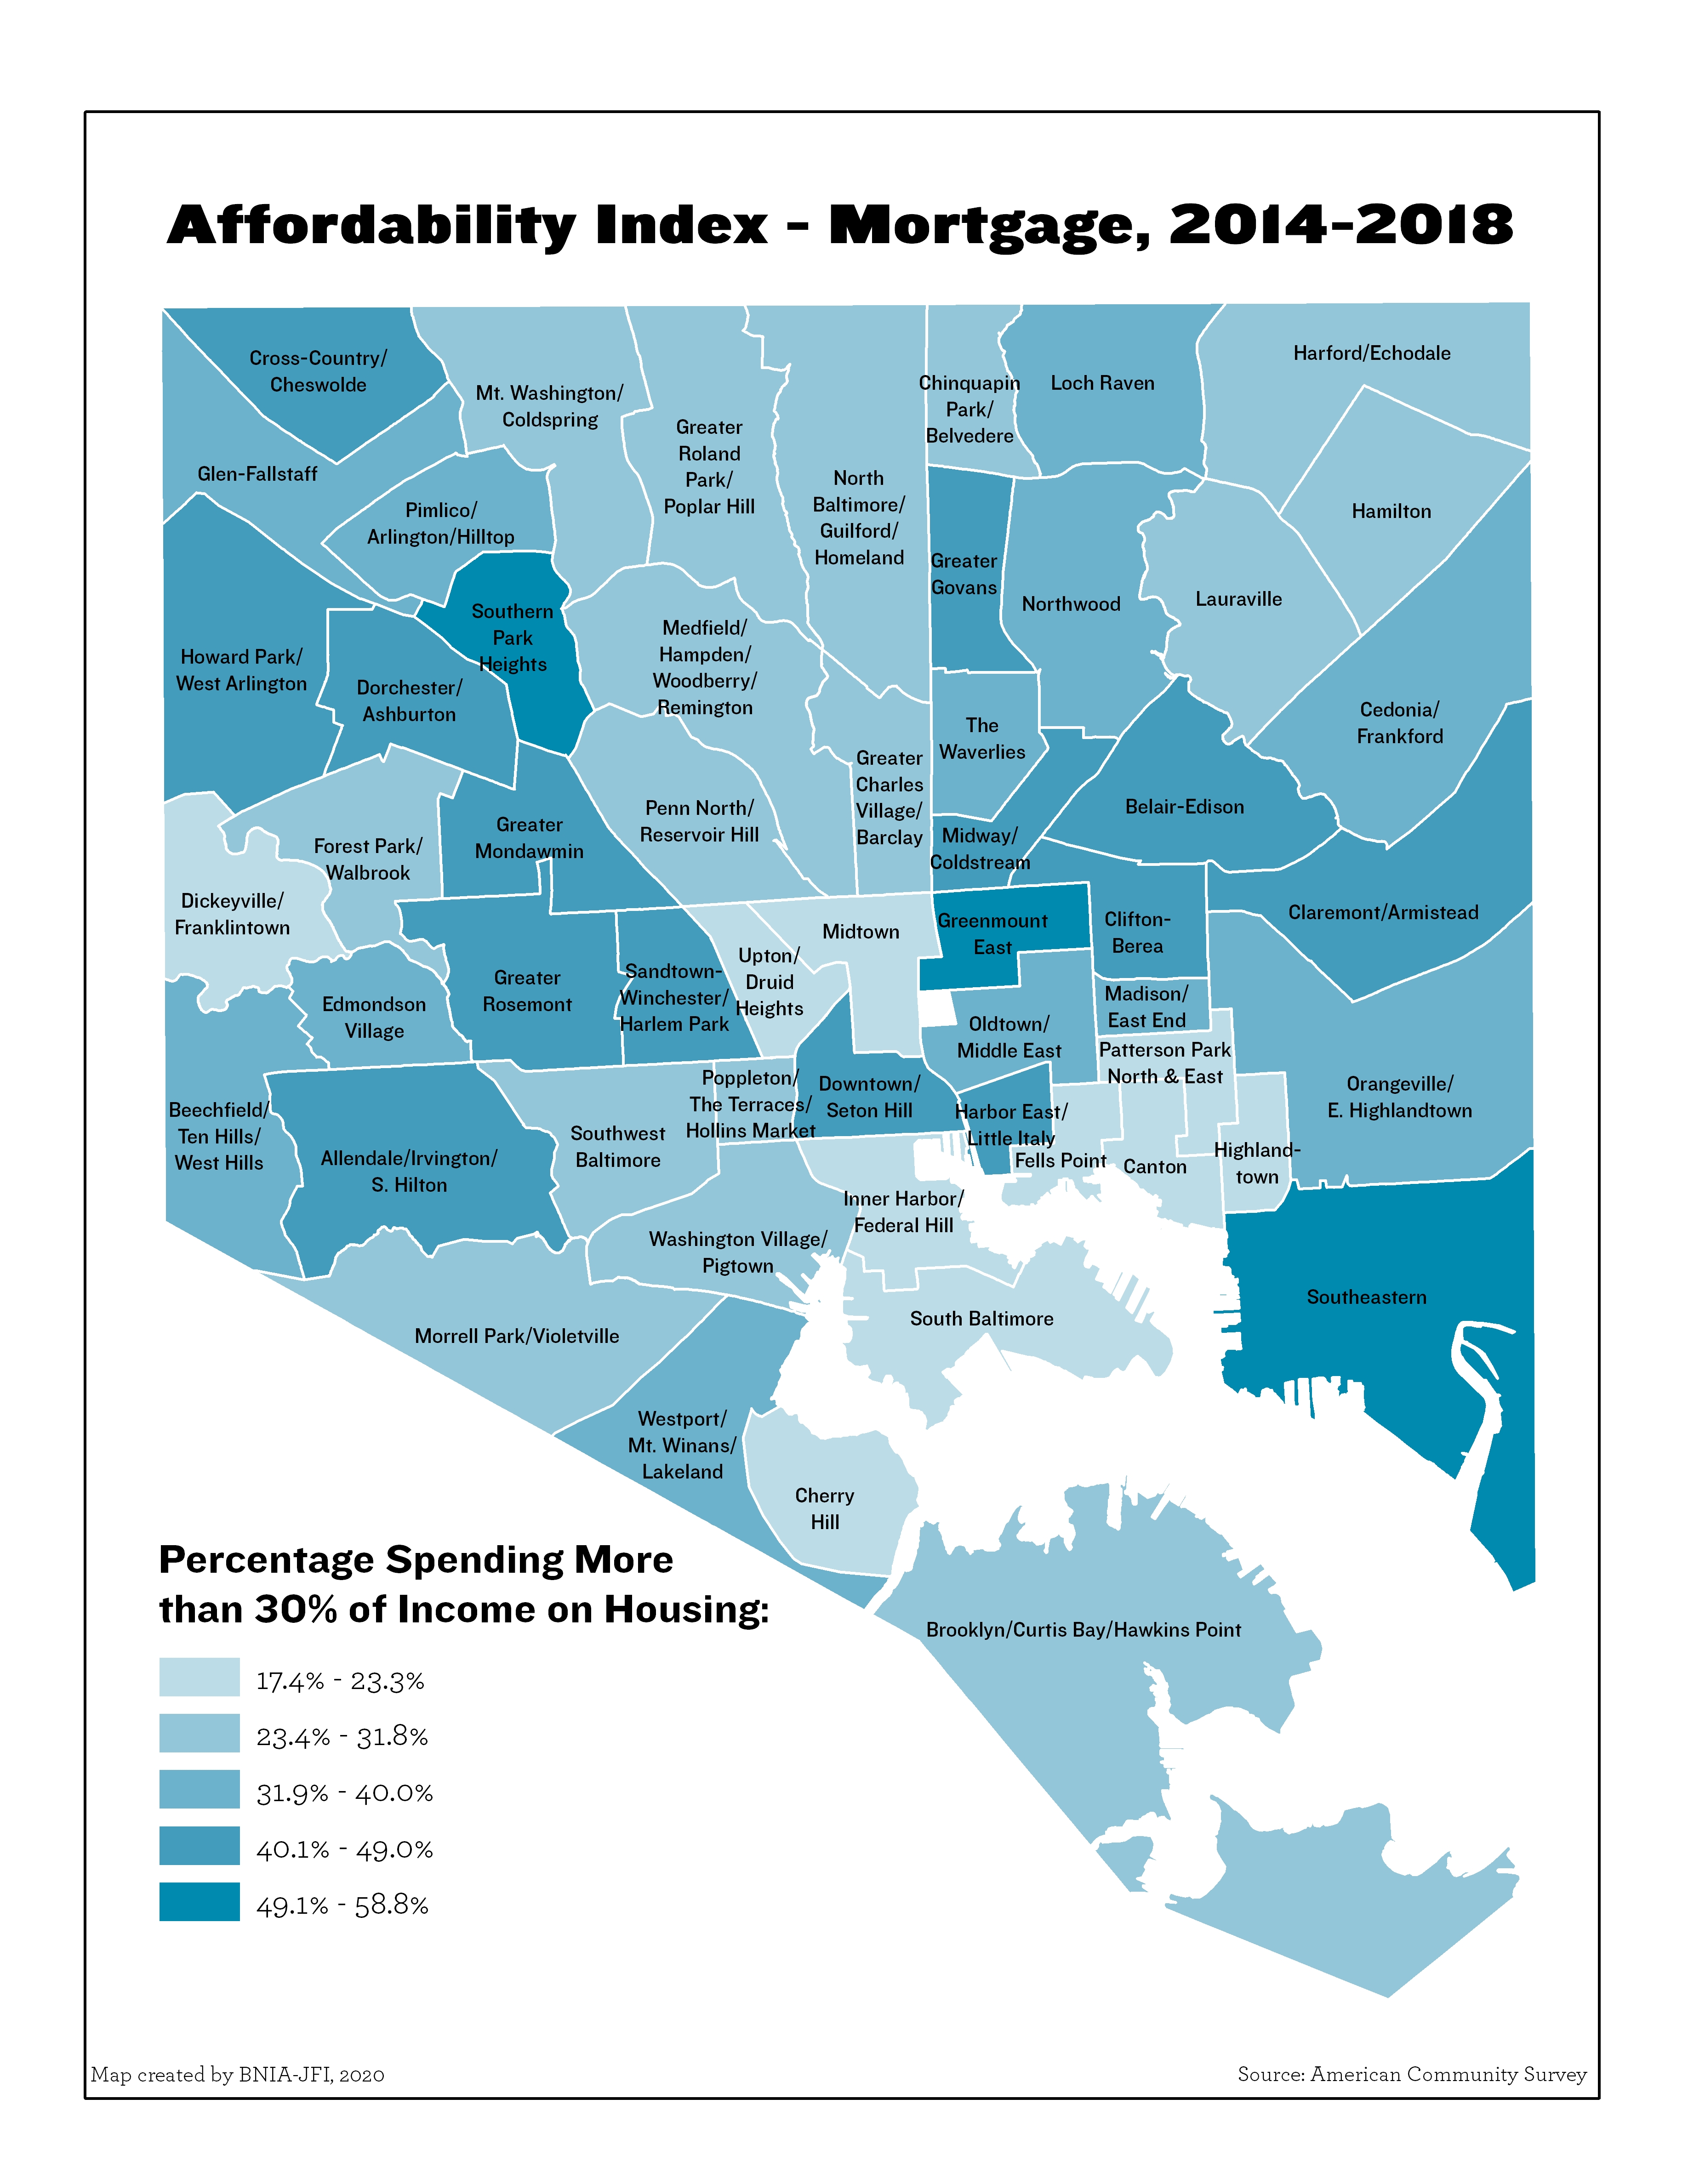
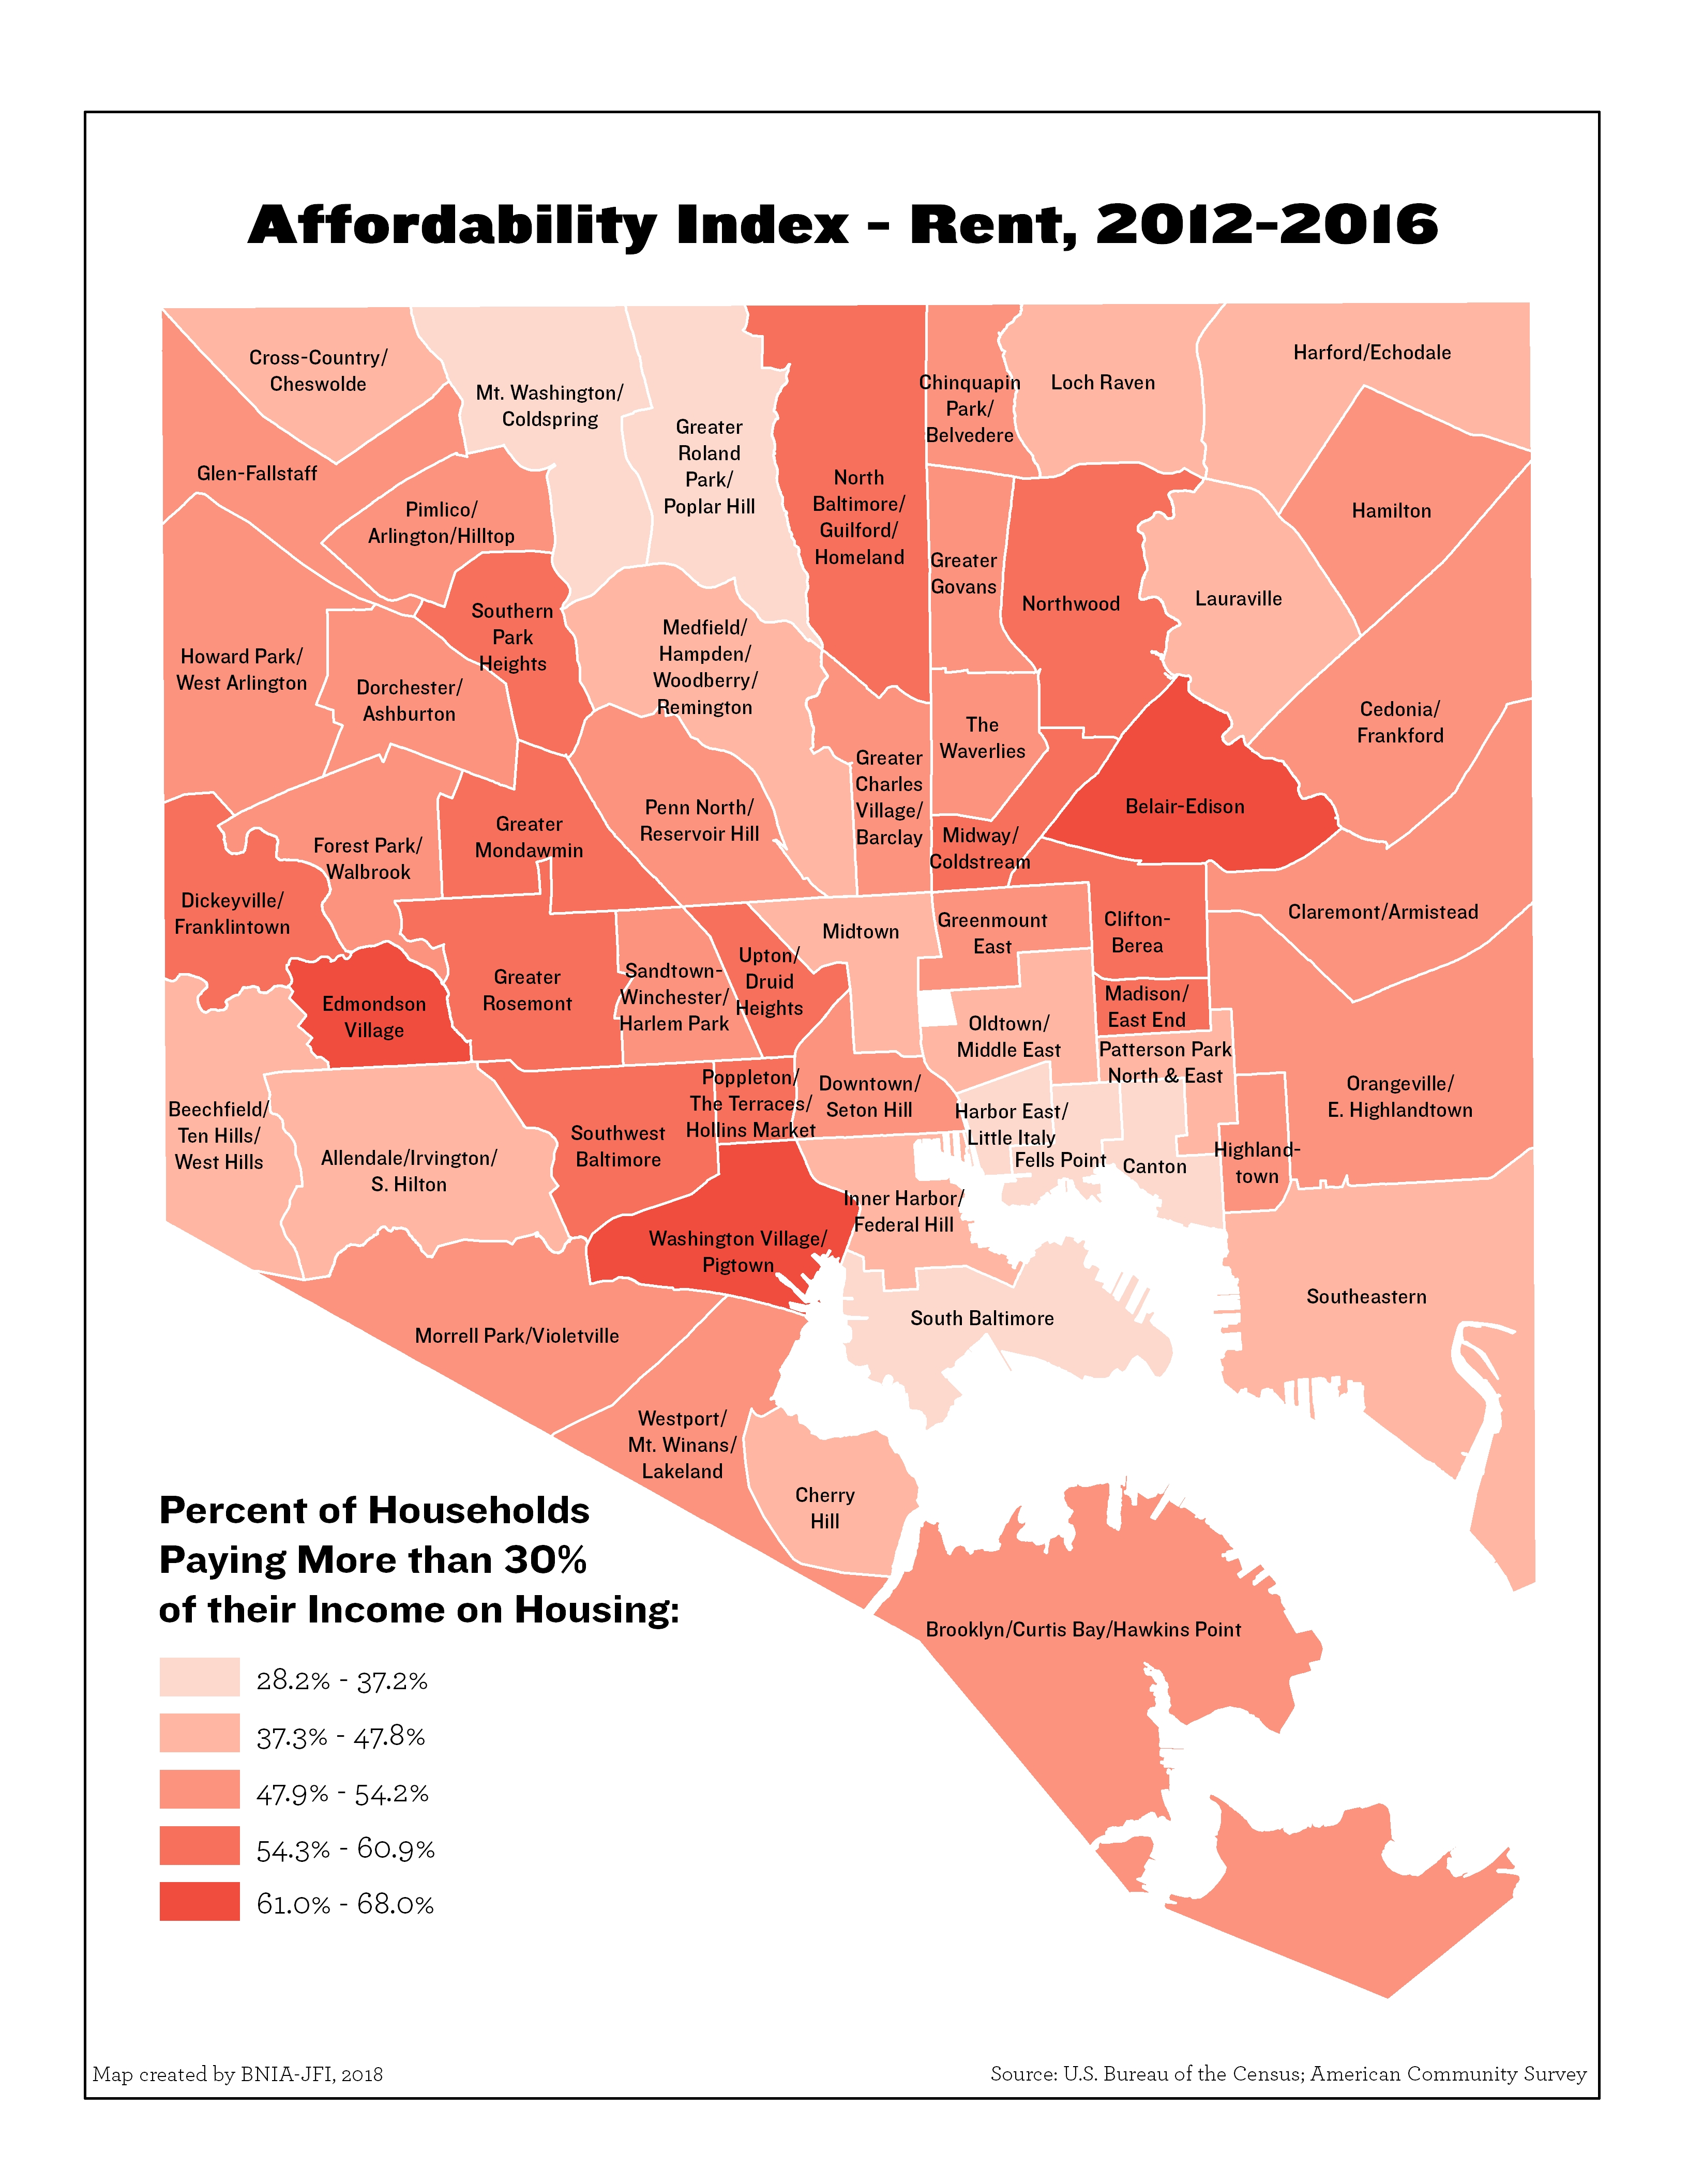
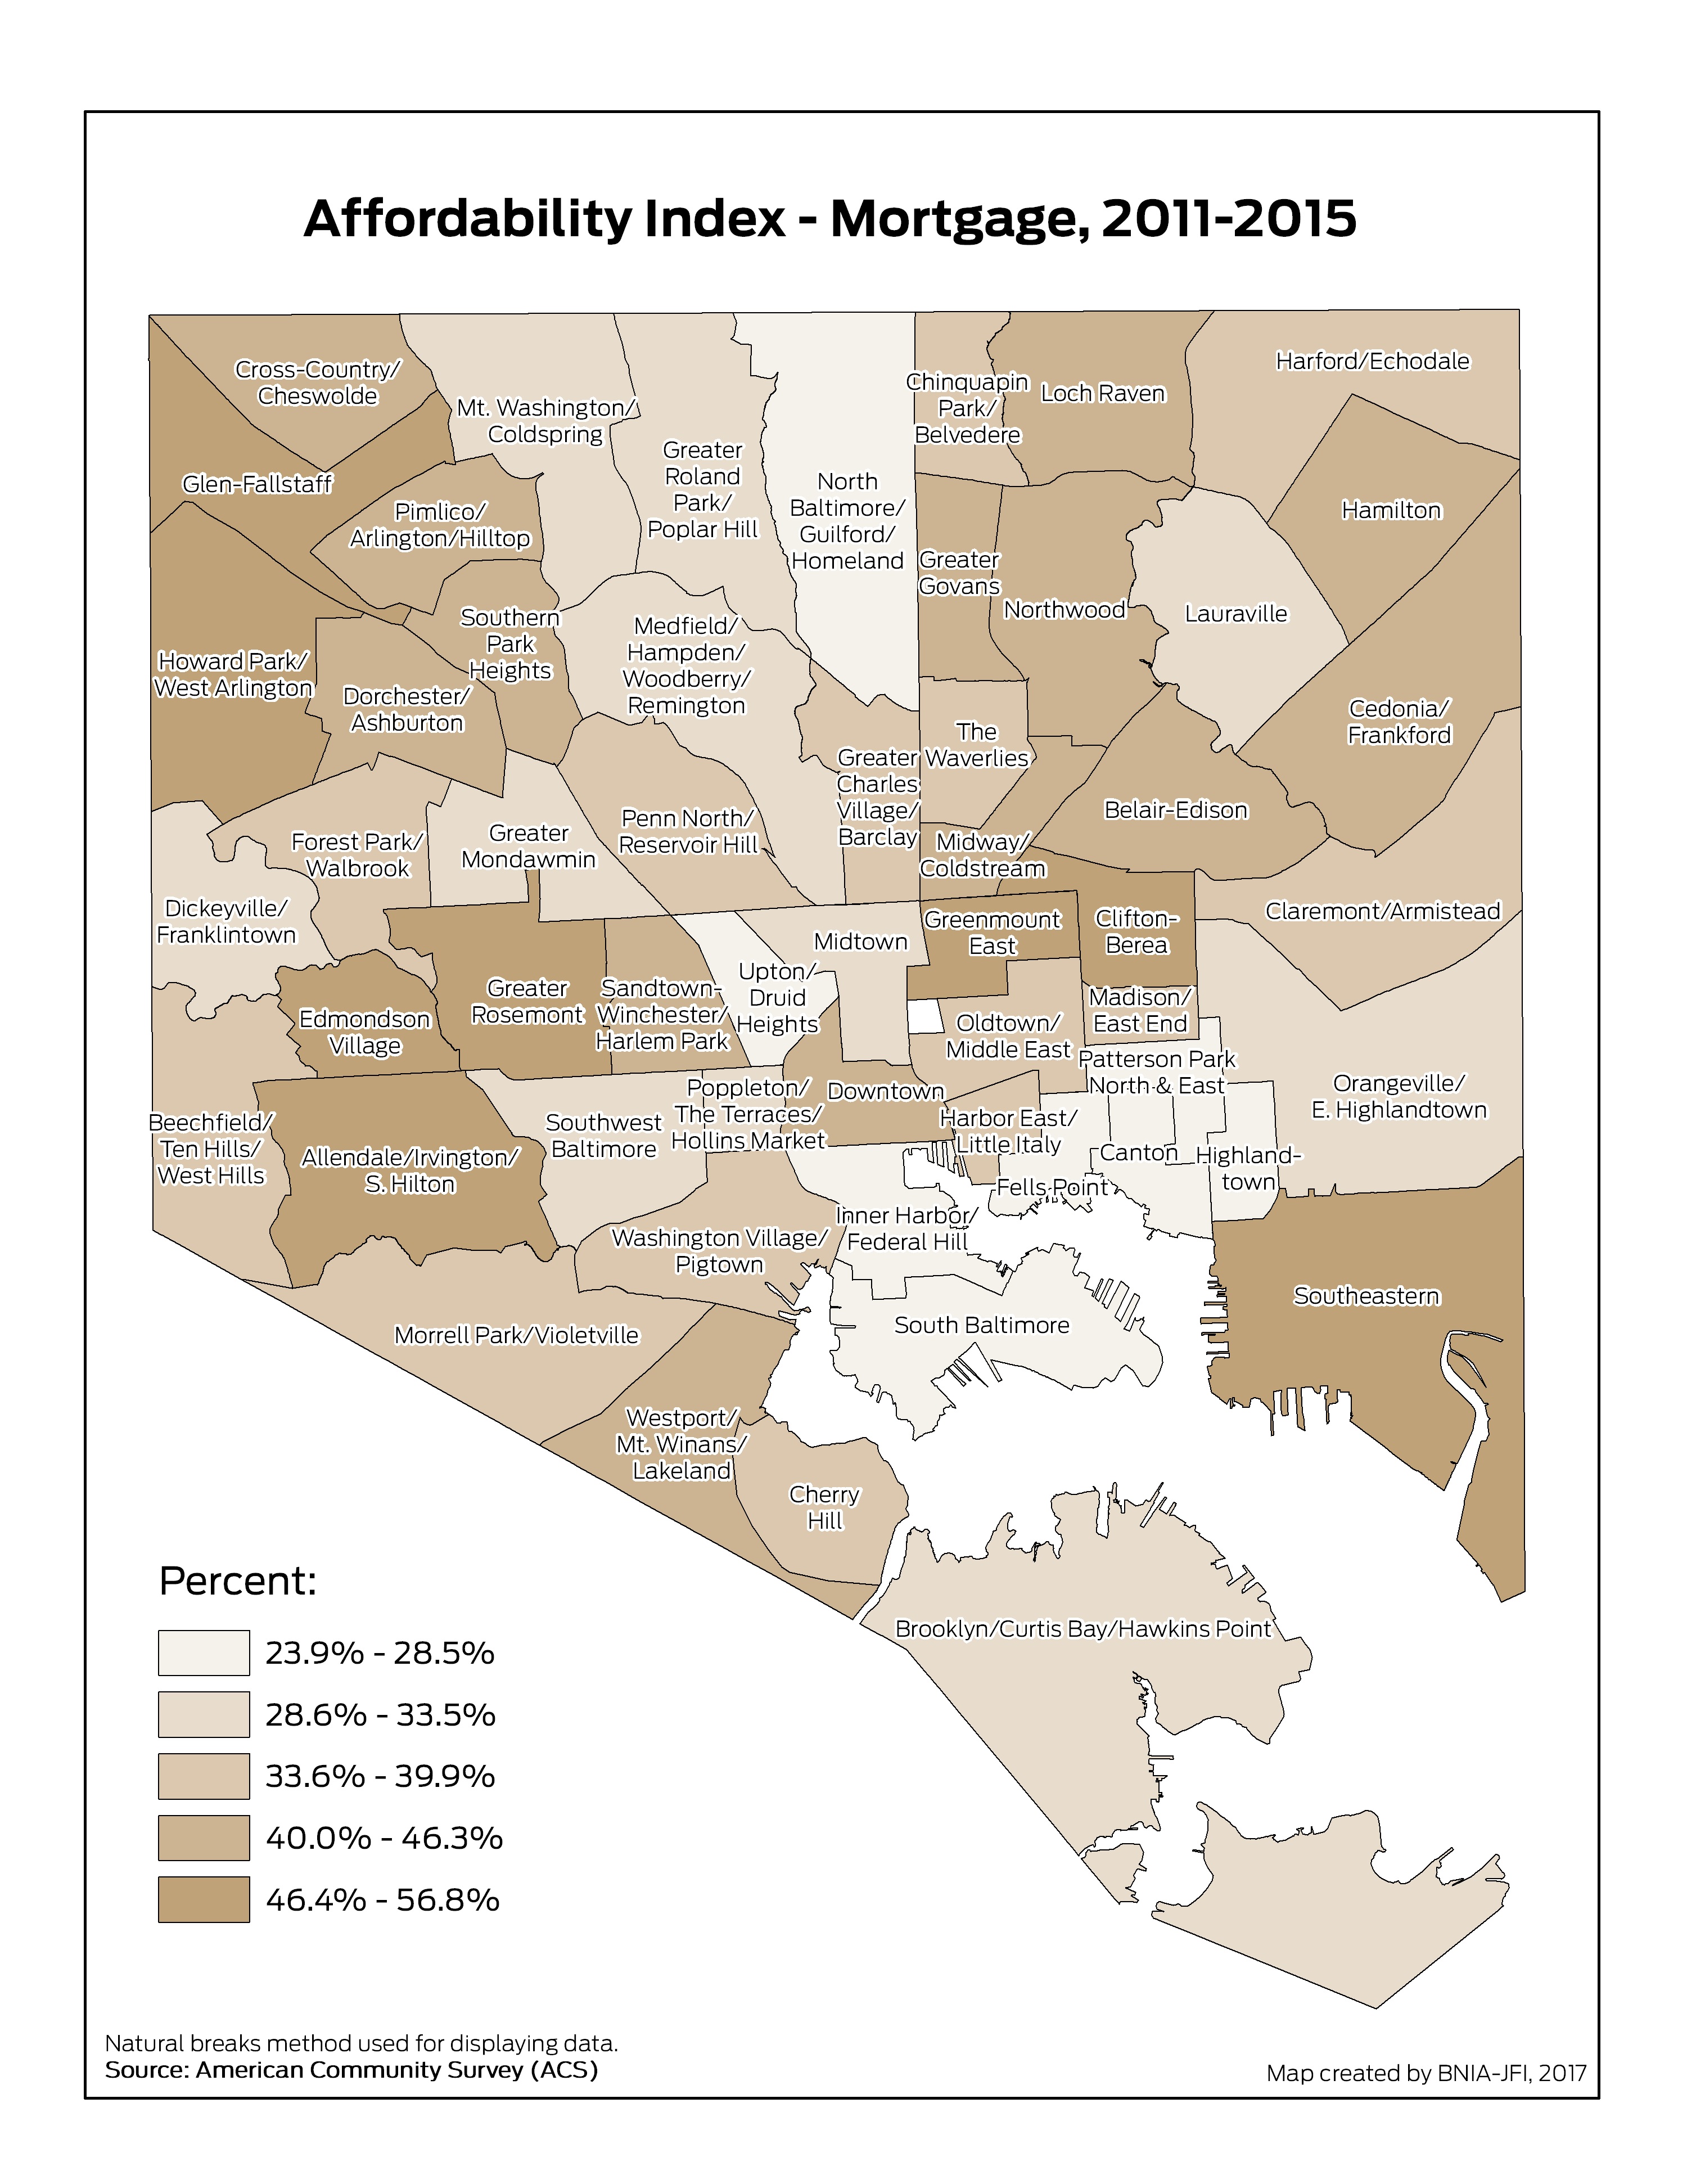
Affordability Index – Rent
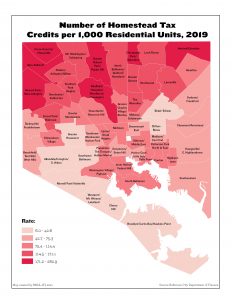
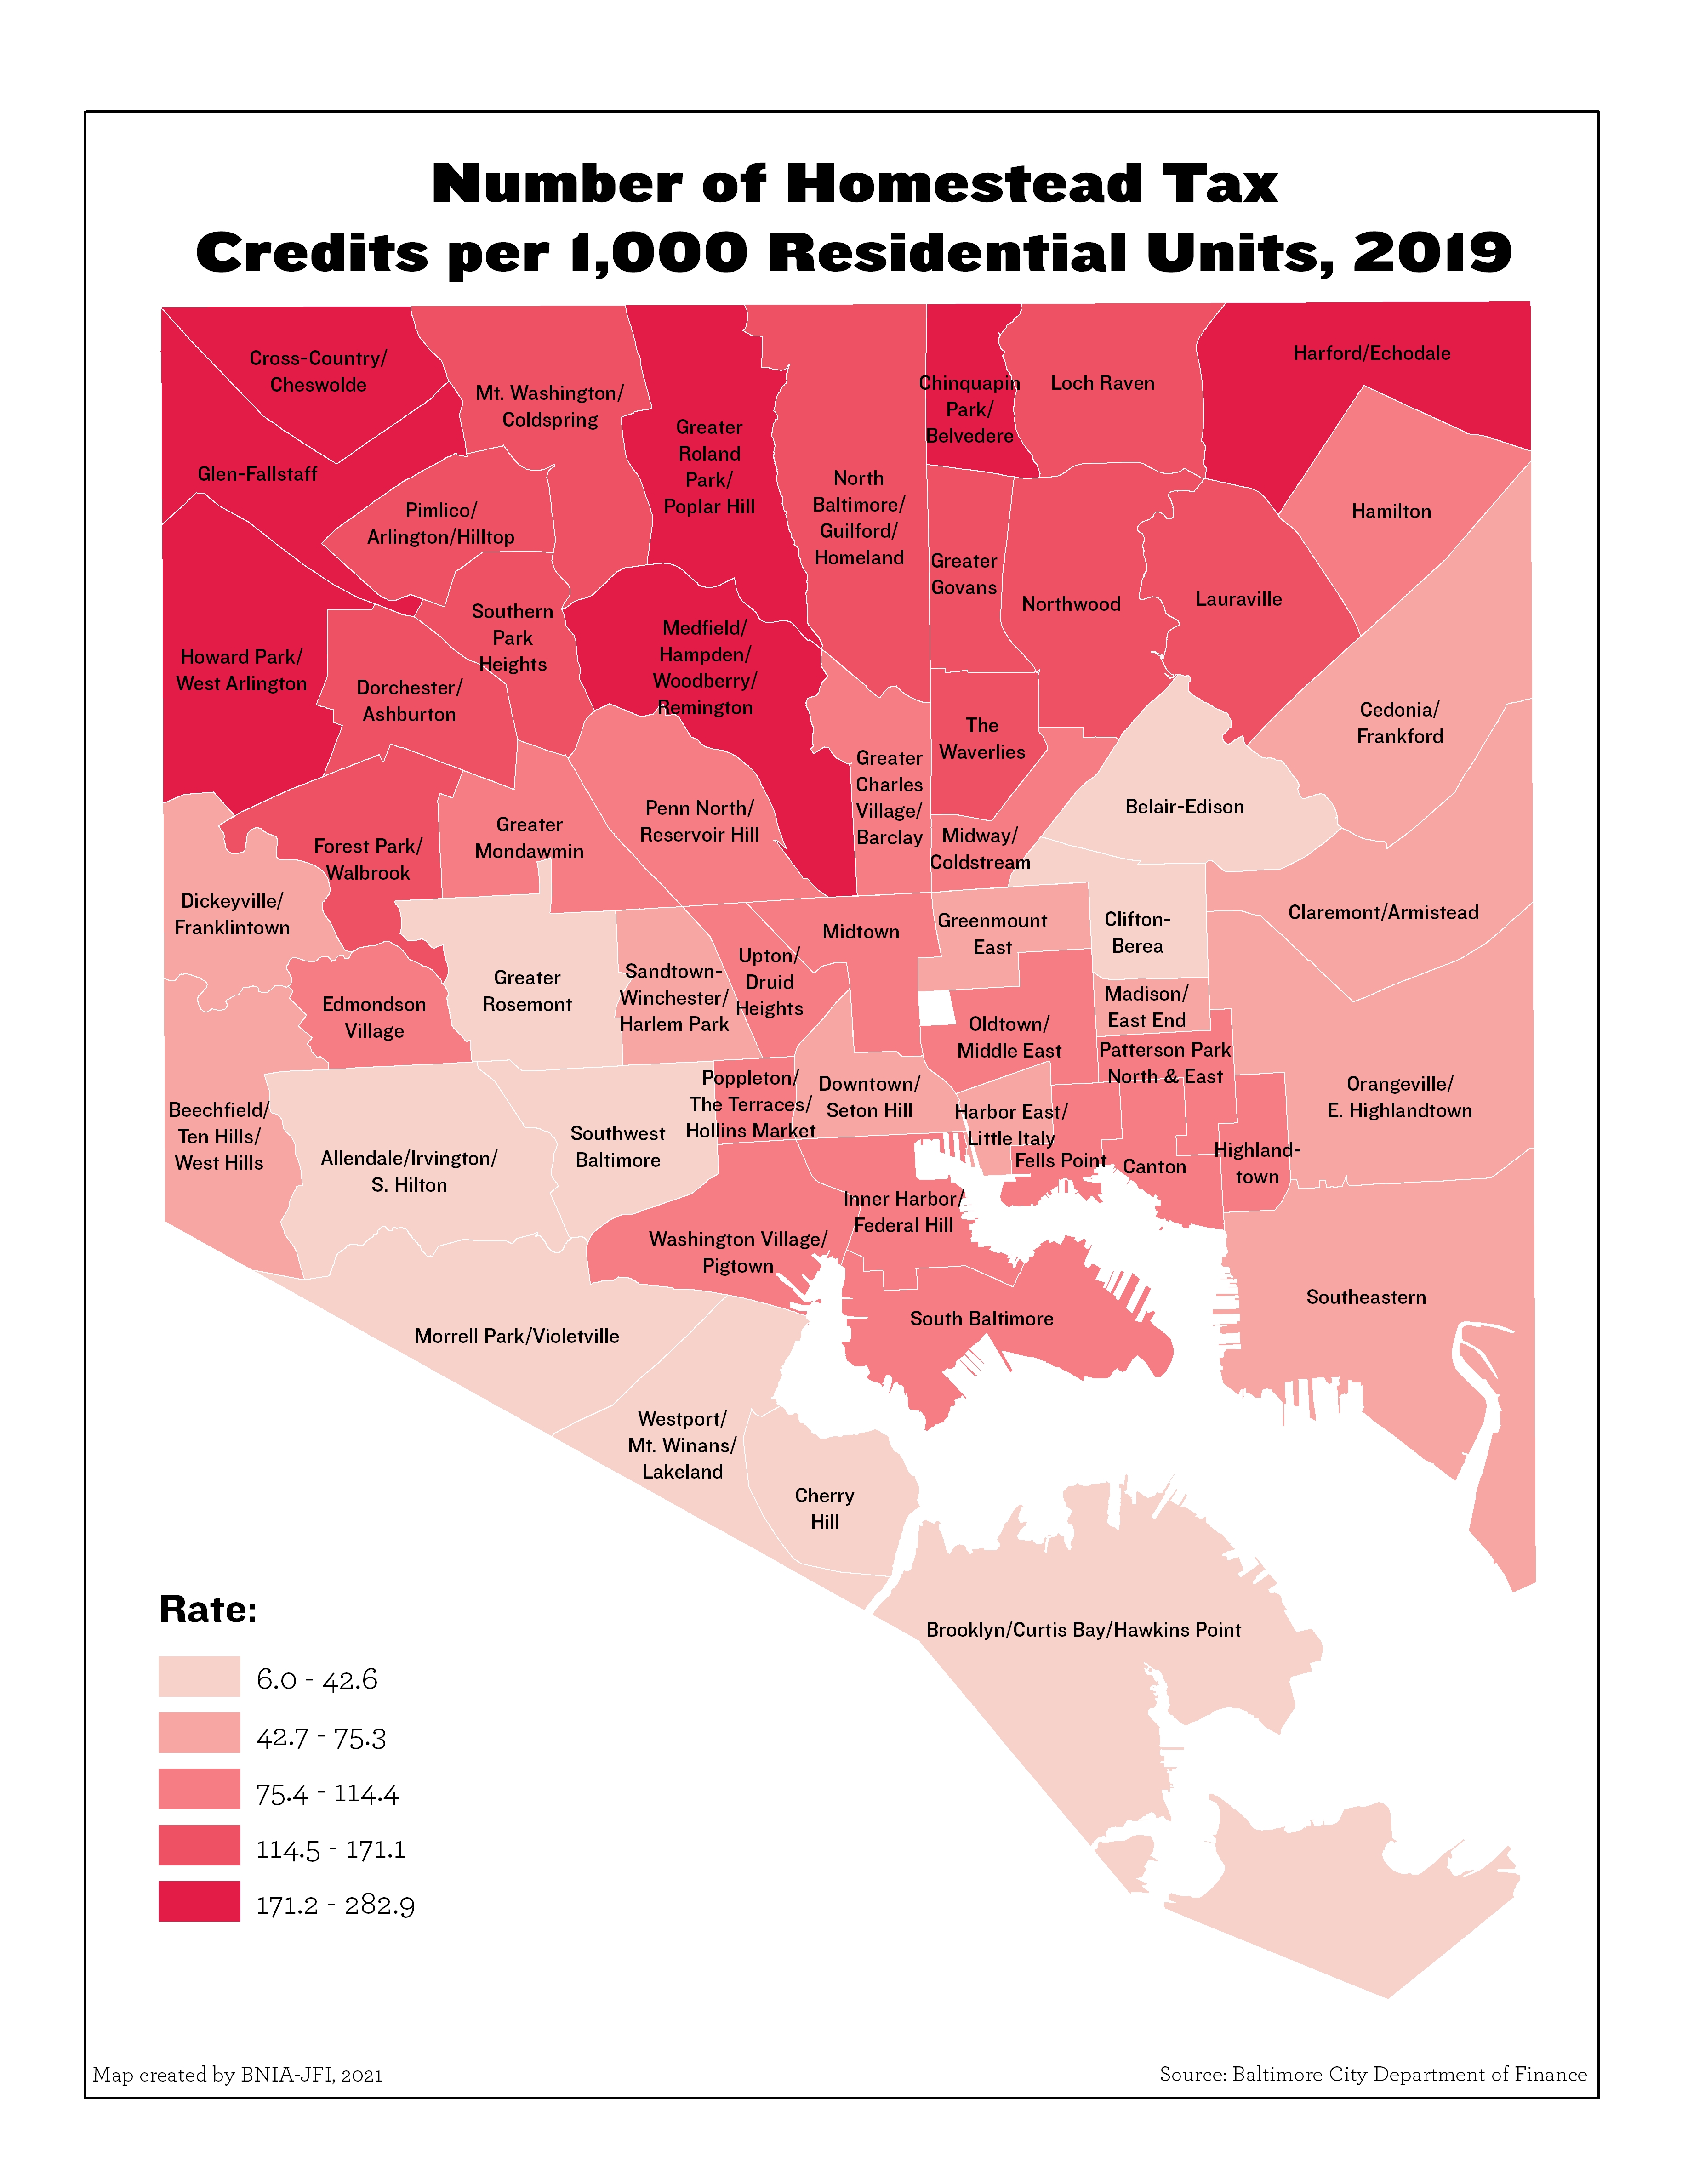
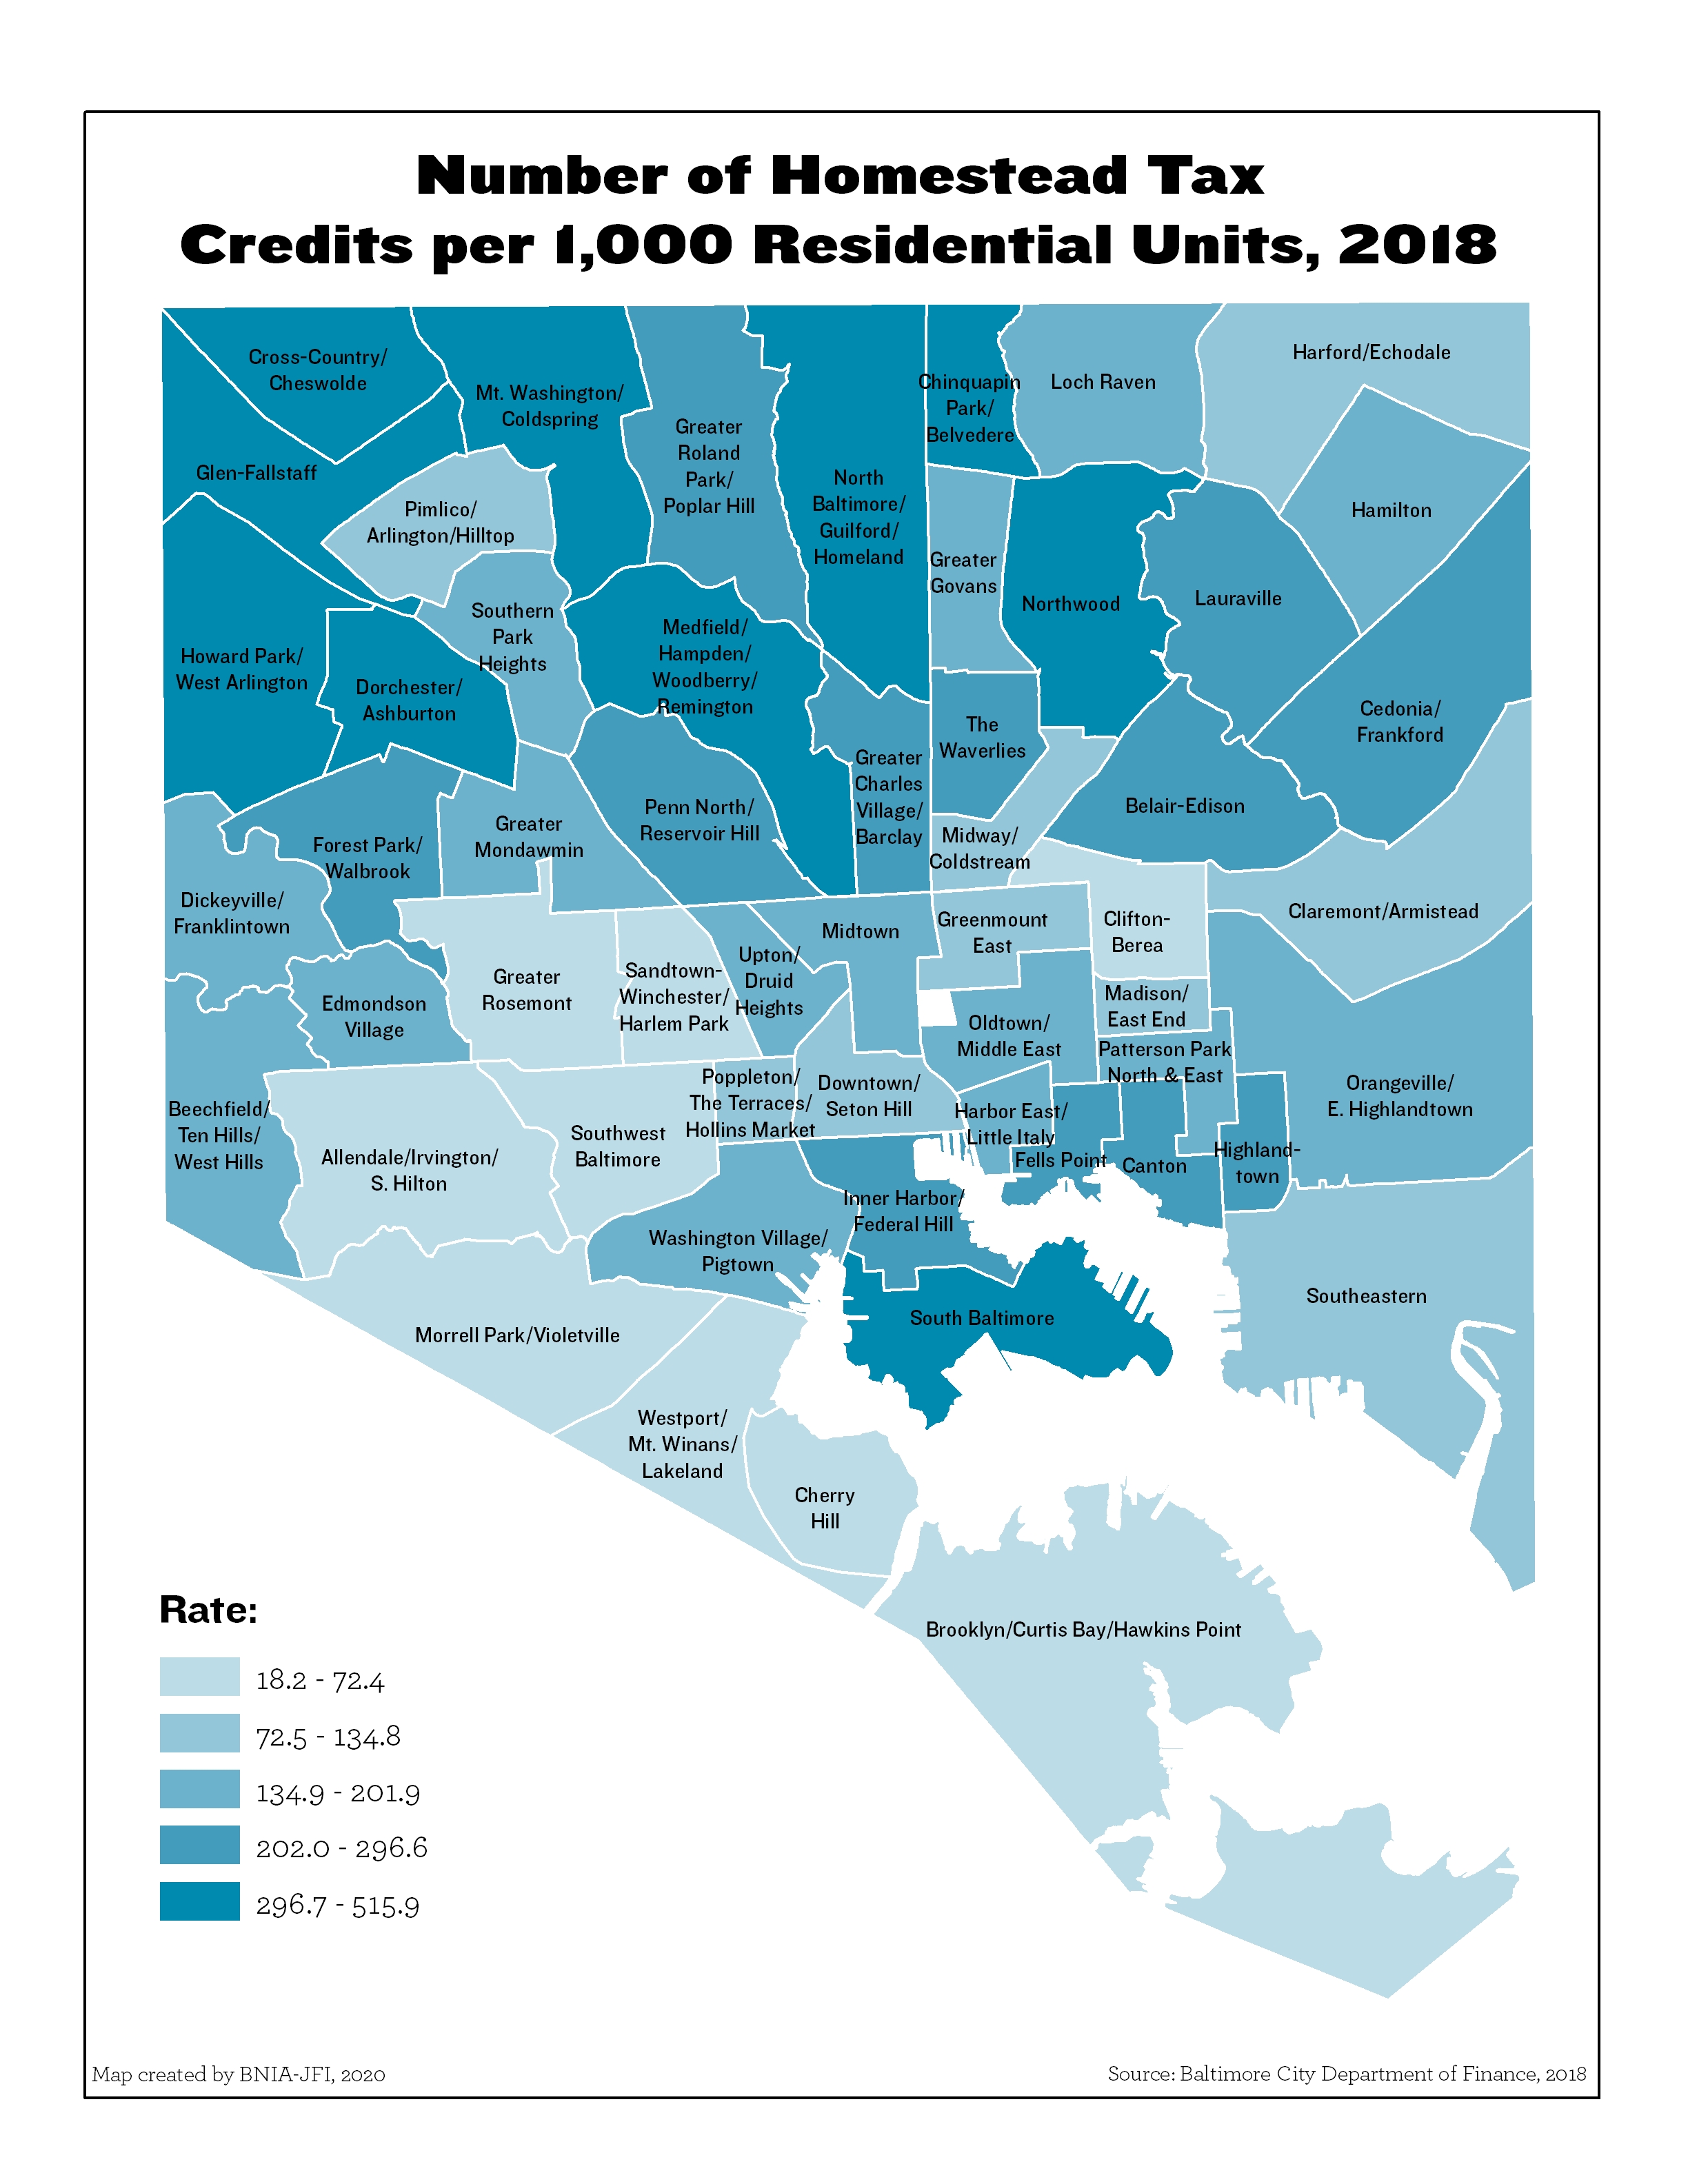
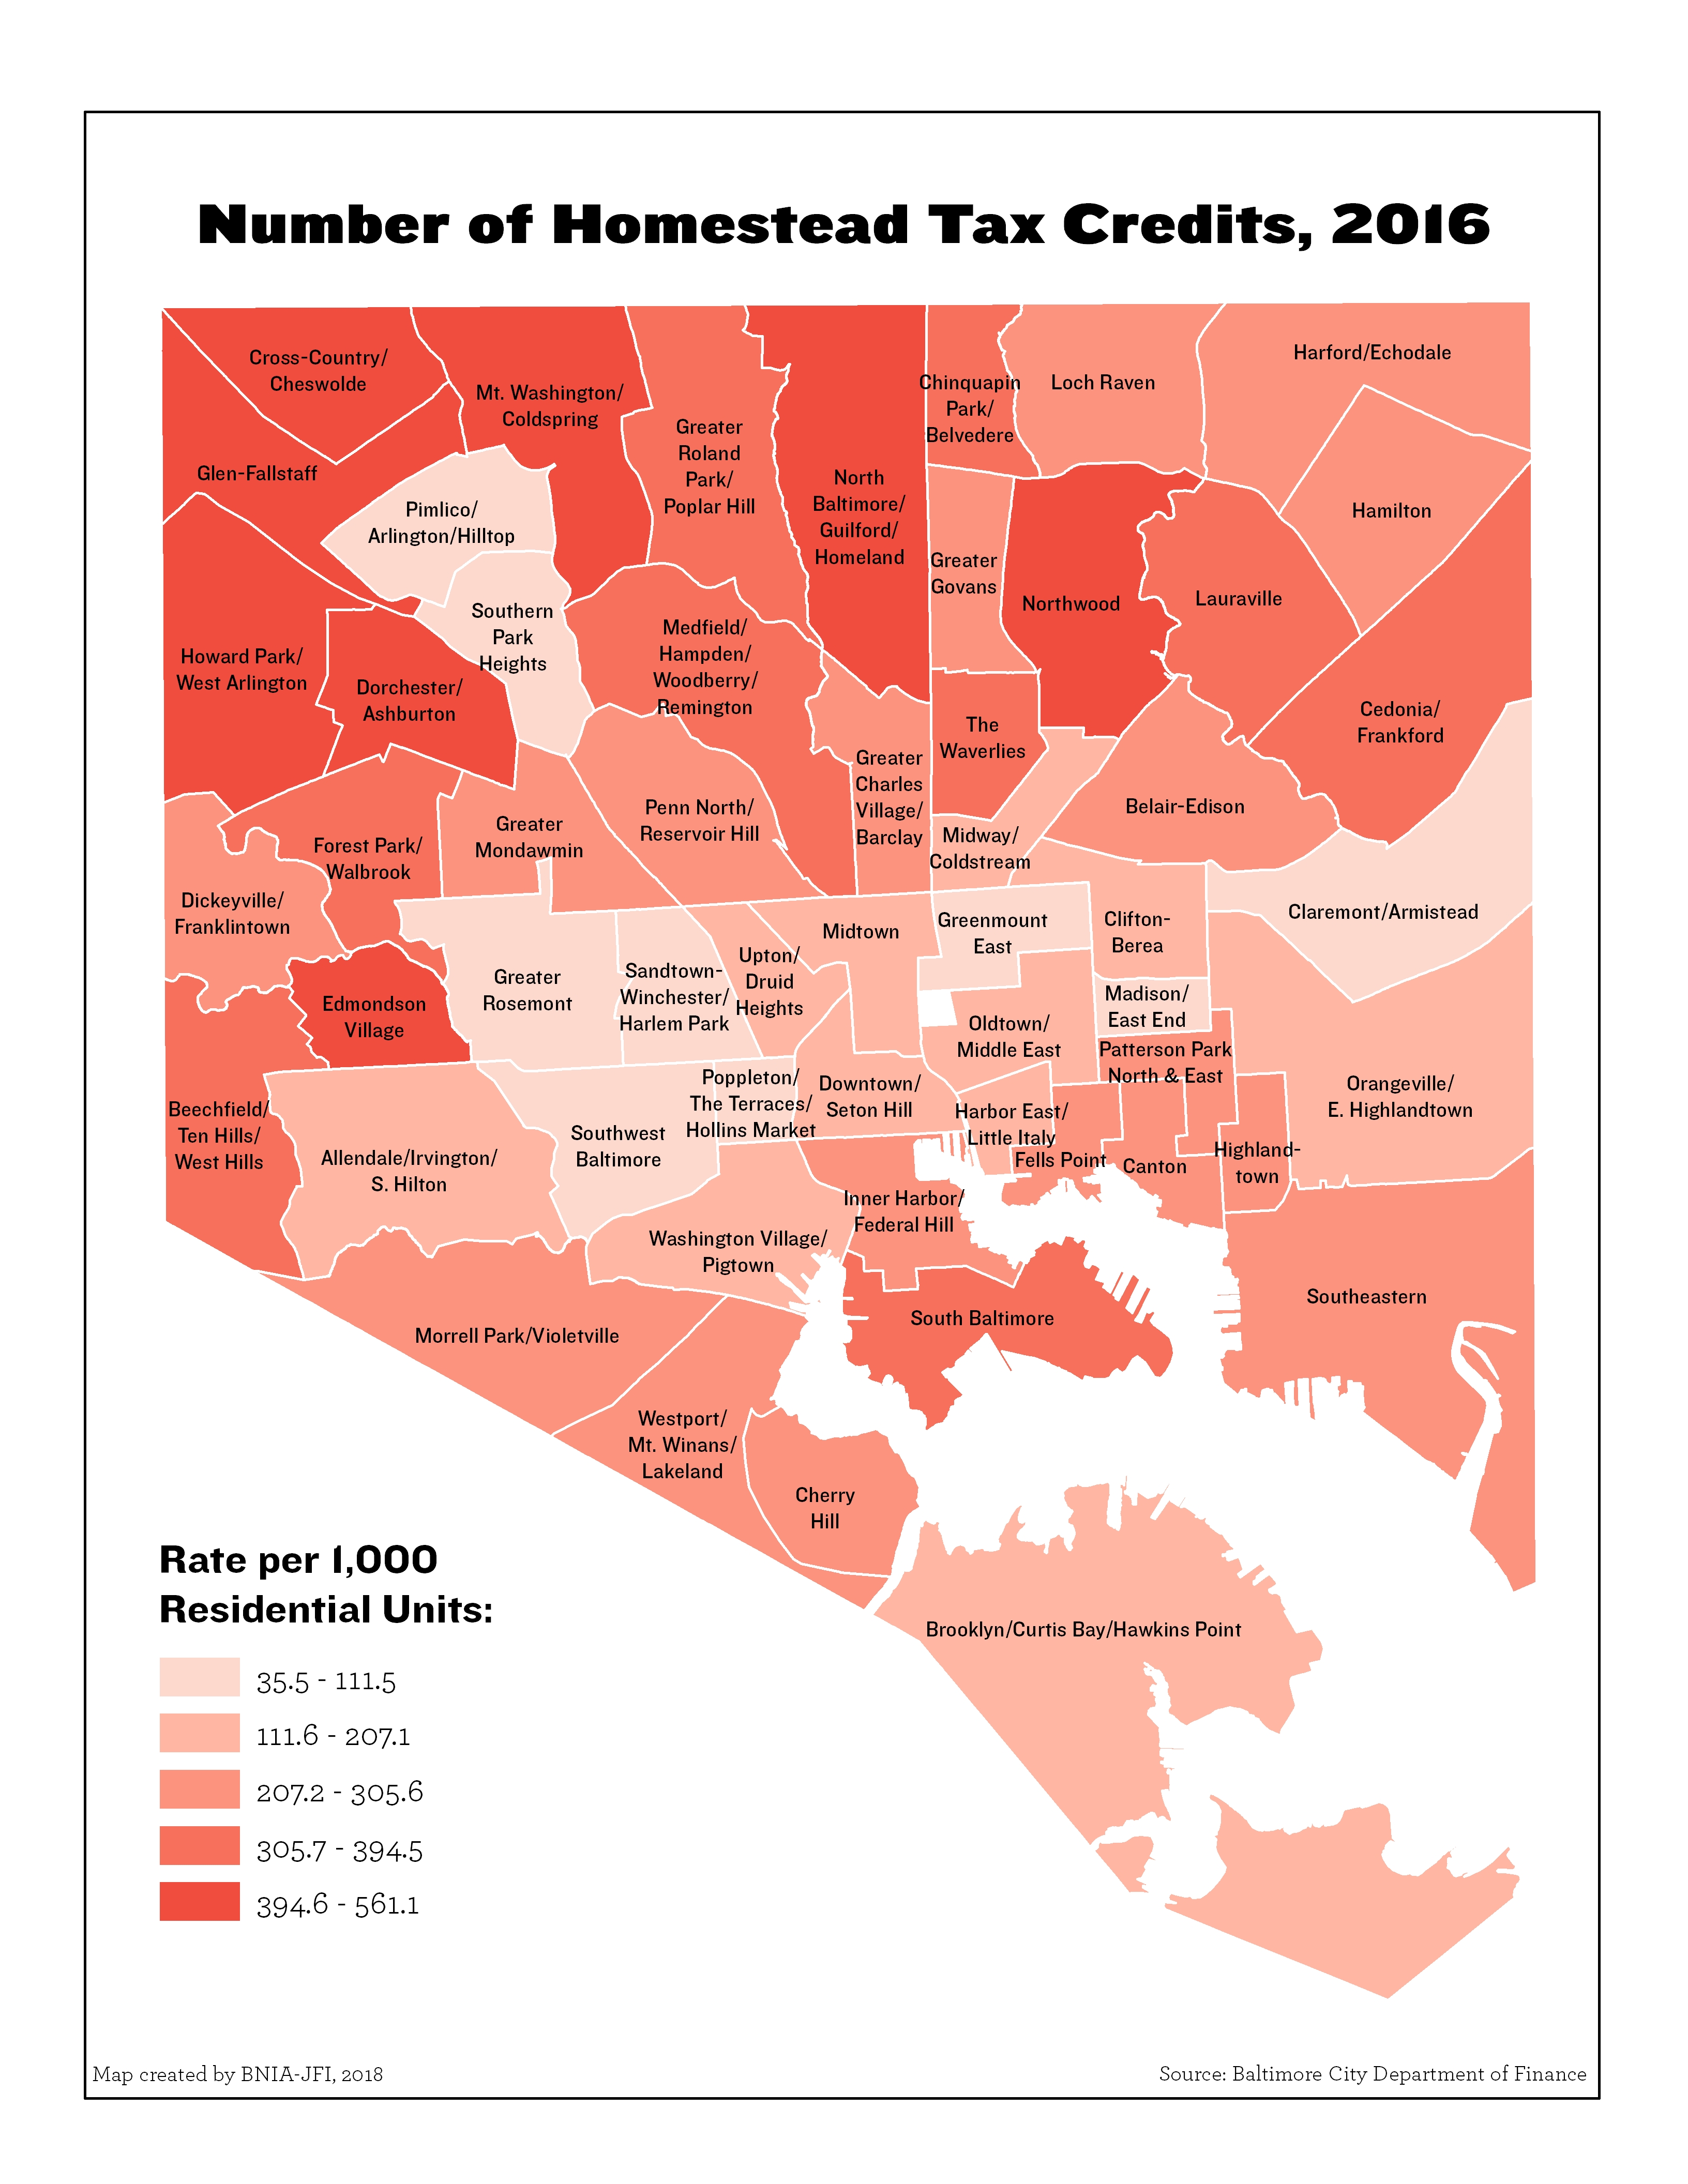
Number of Homestead Tax Credits per 1,000 Residential Units

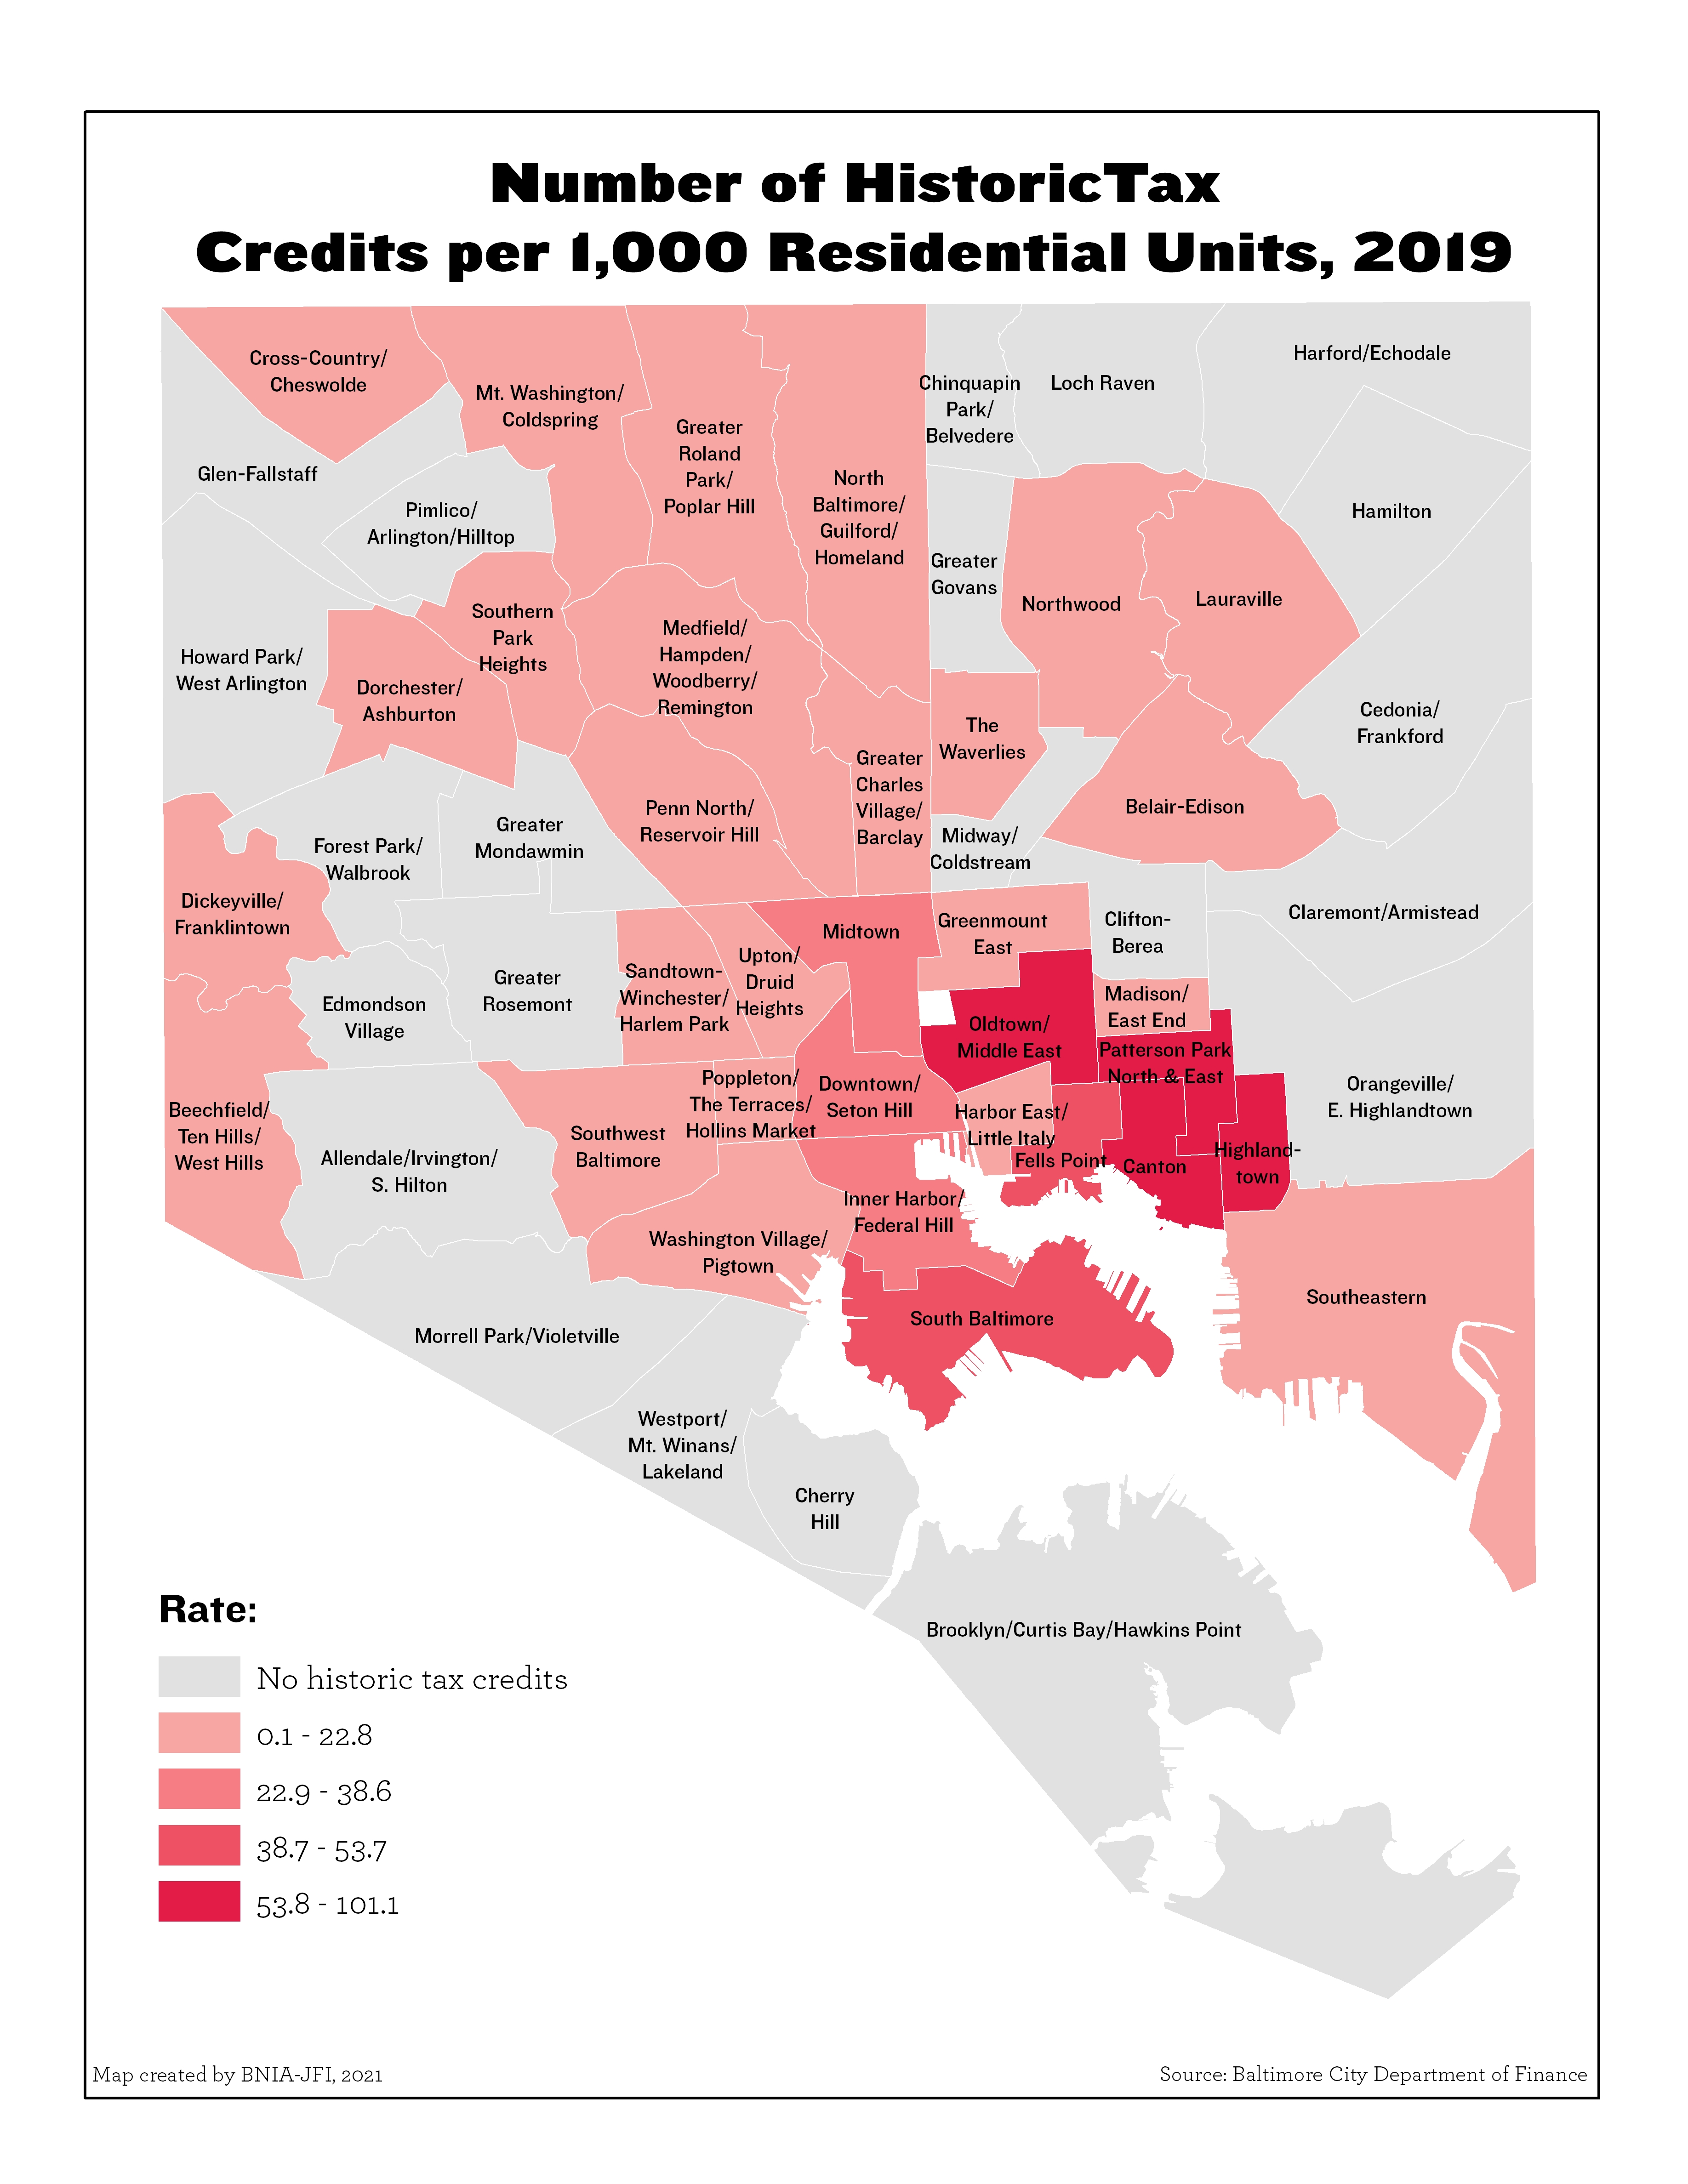
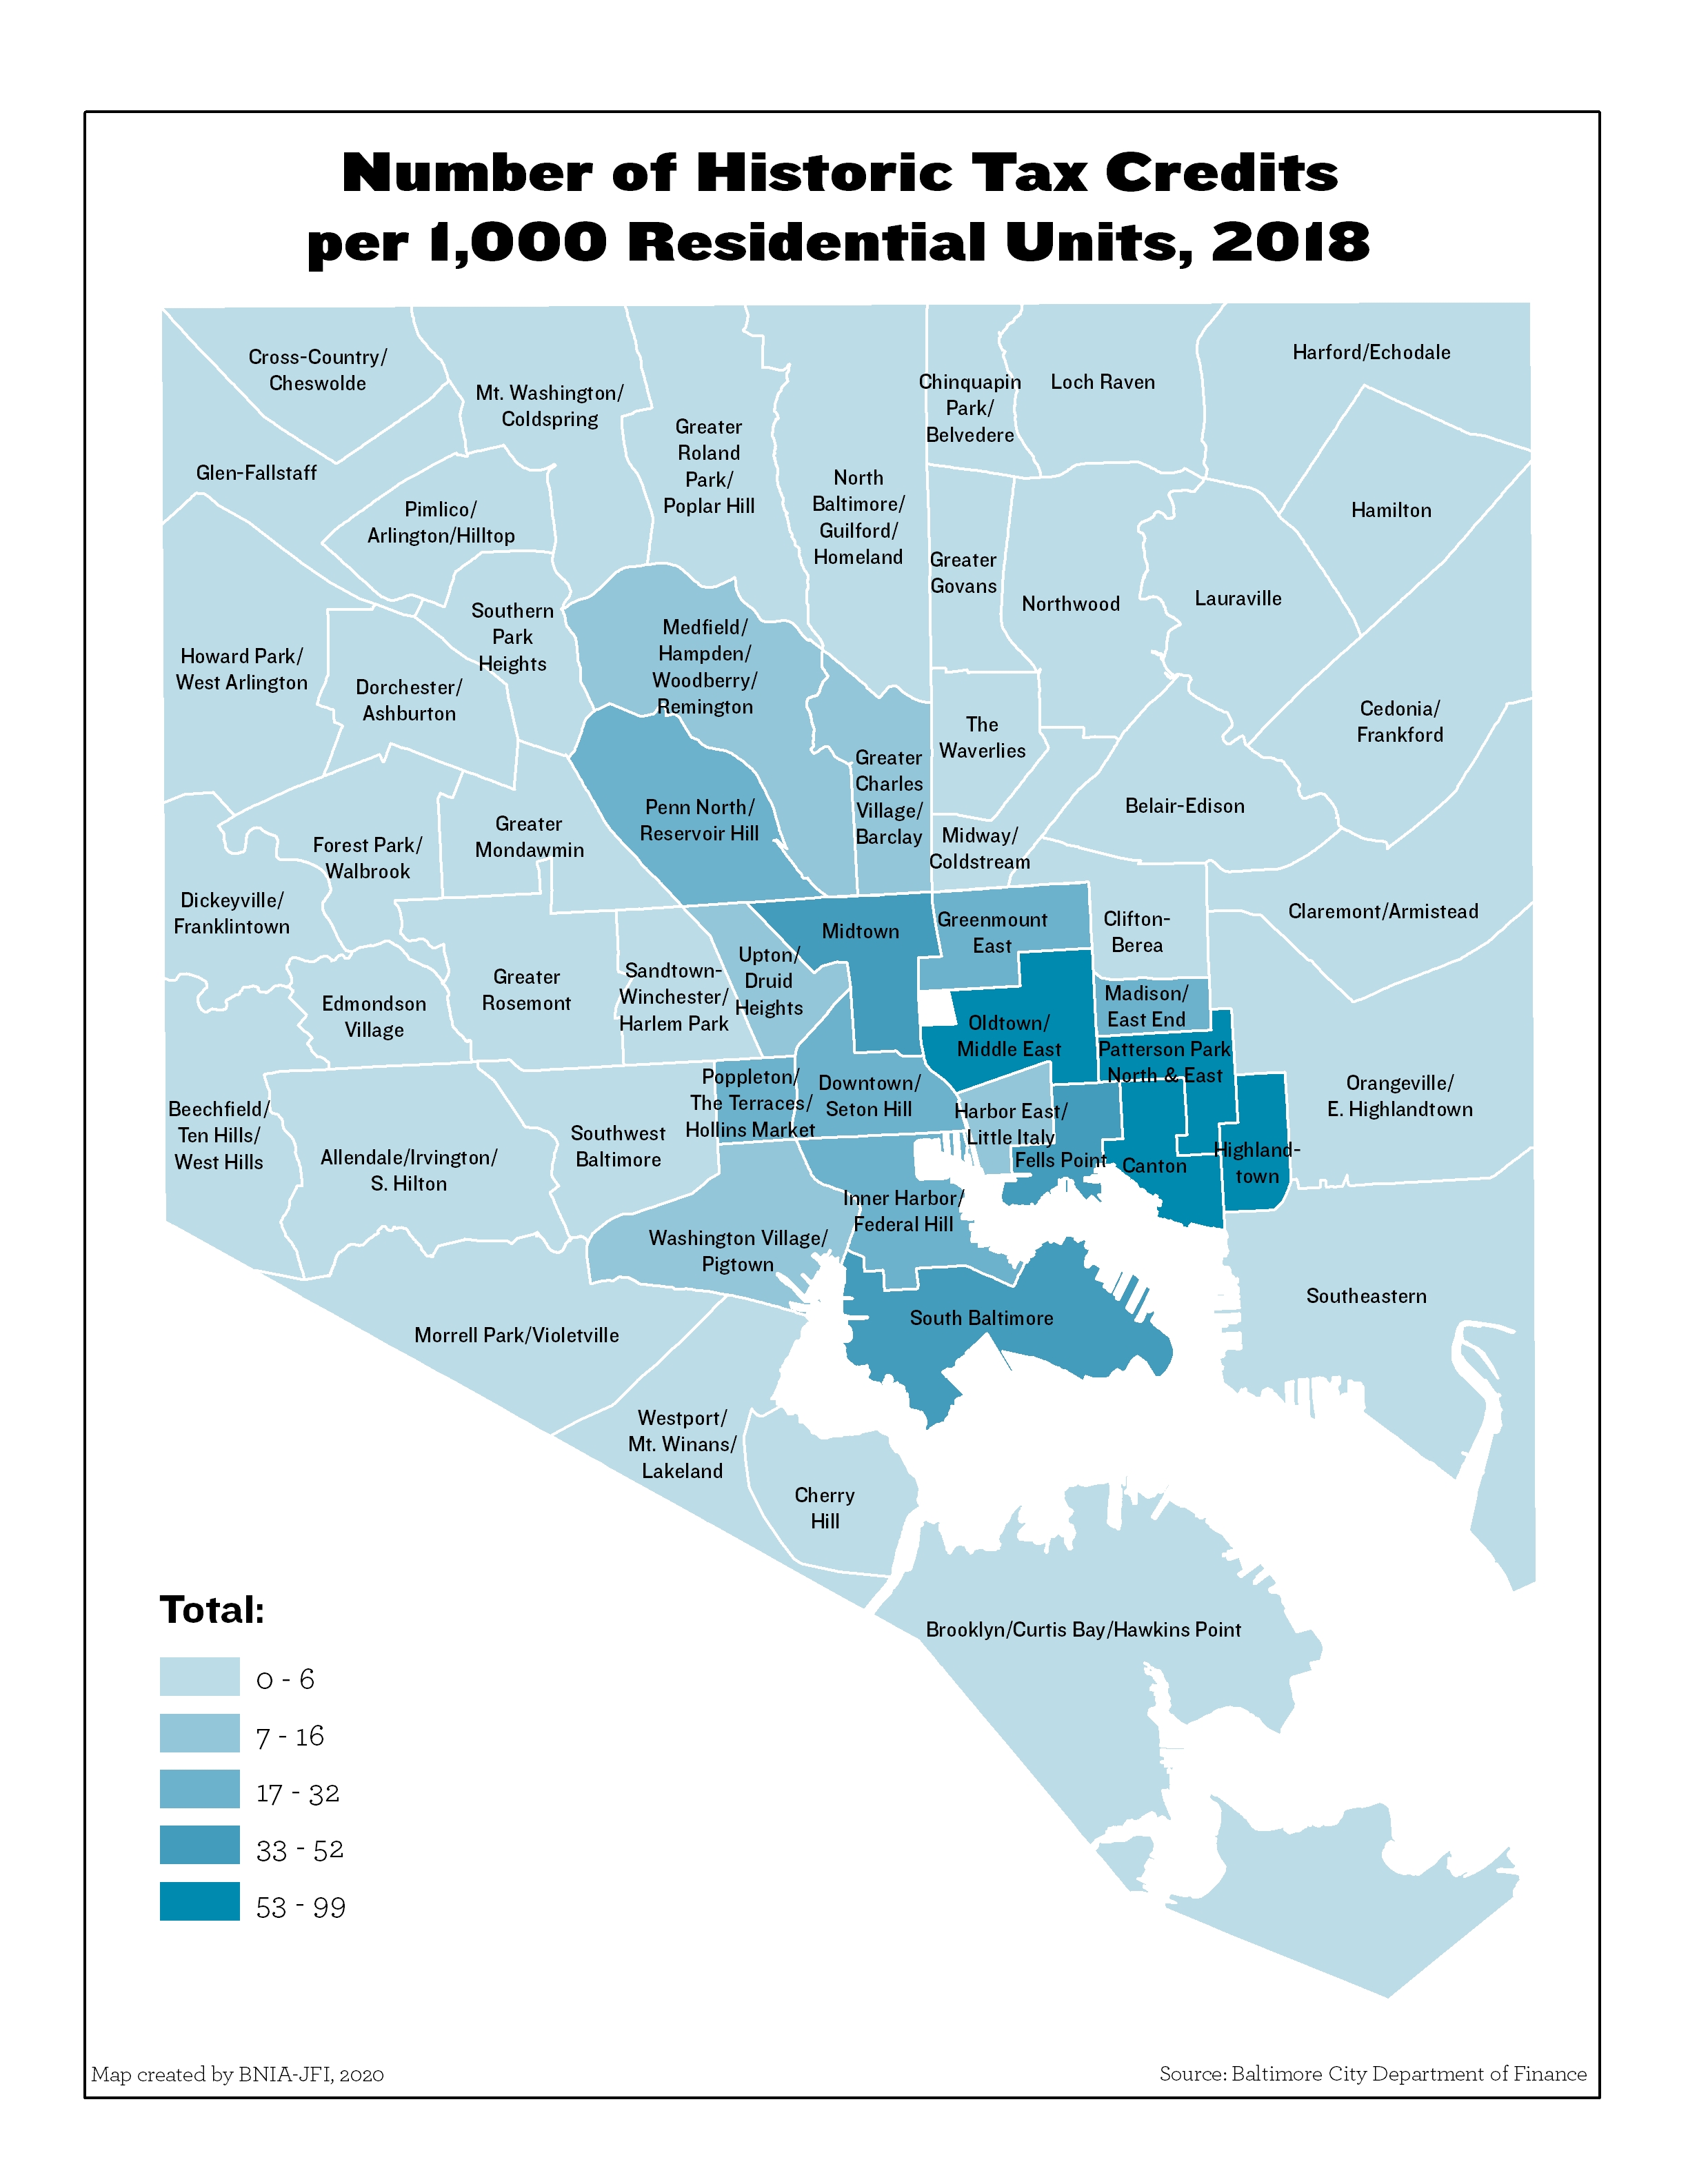
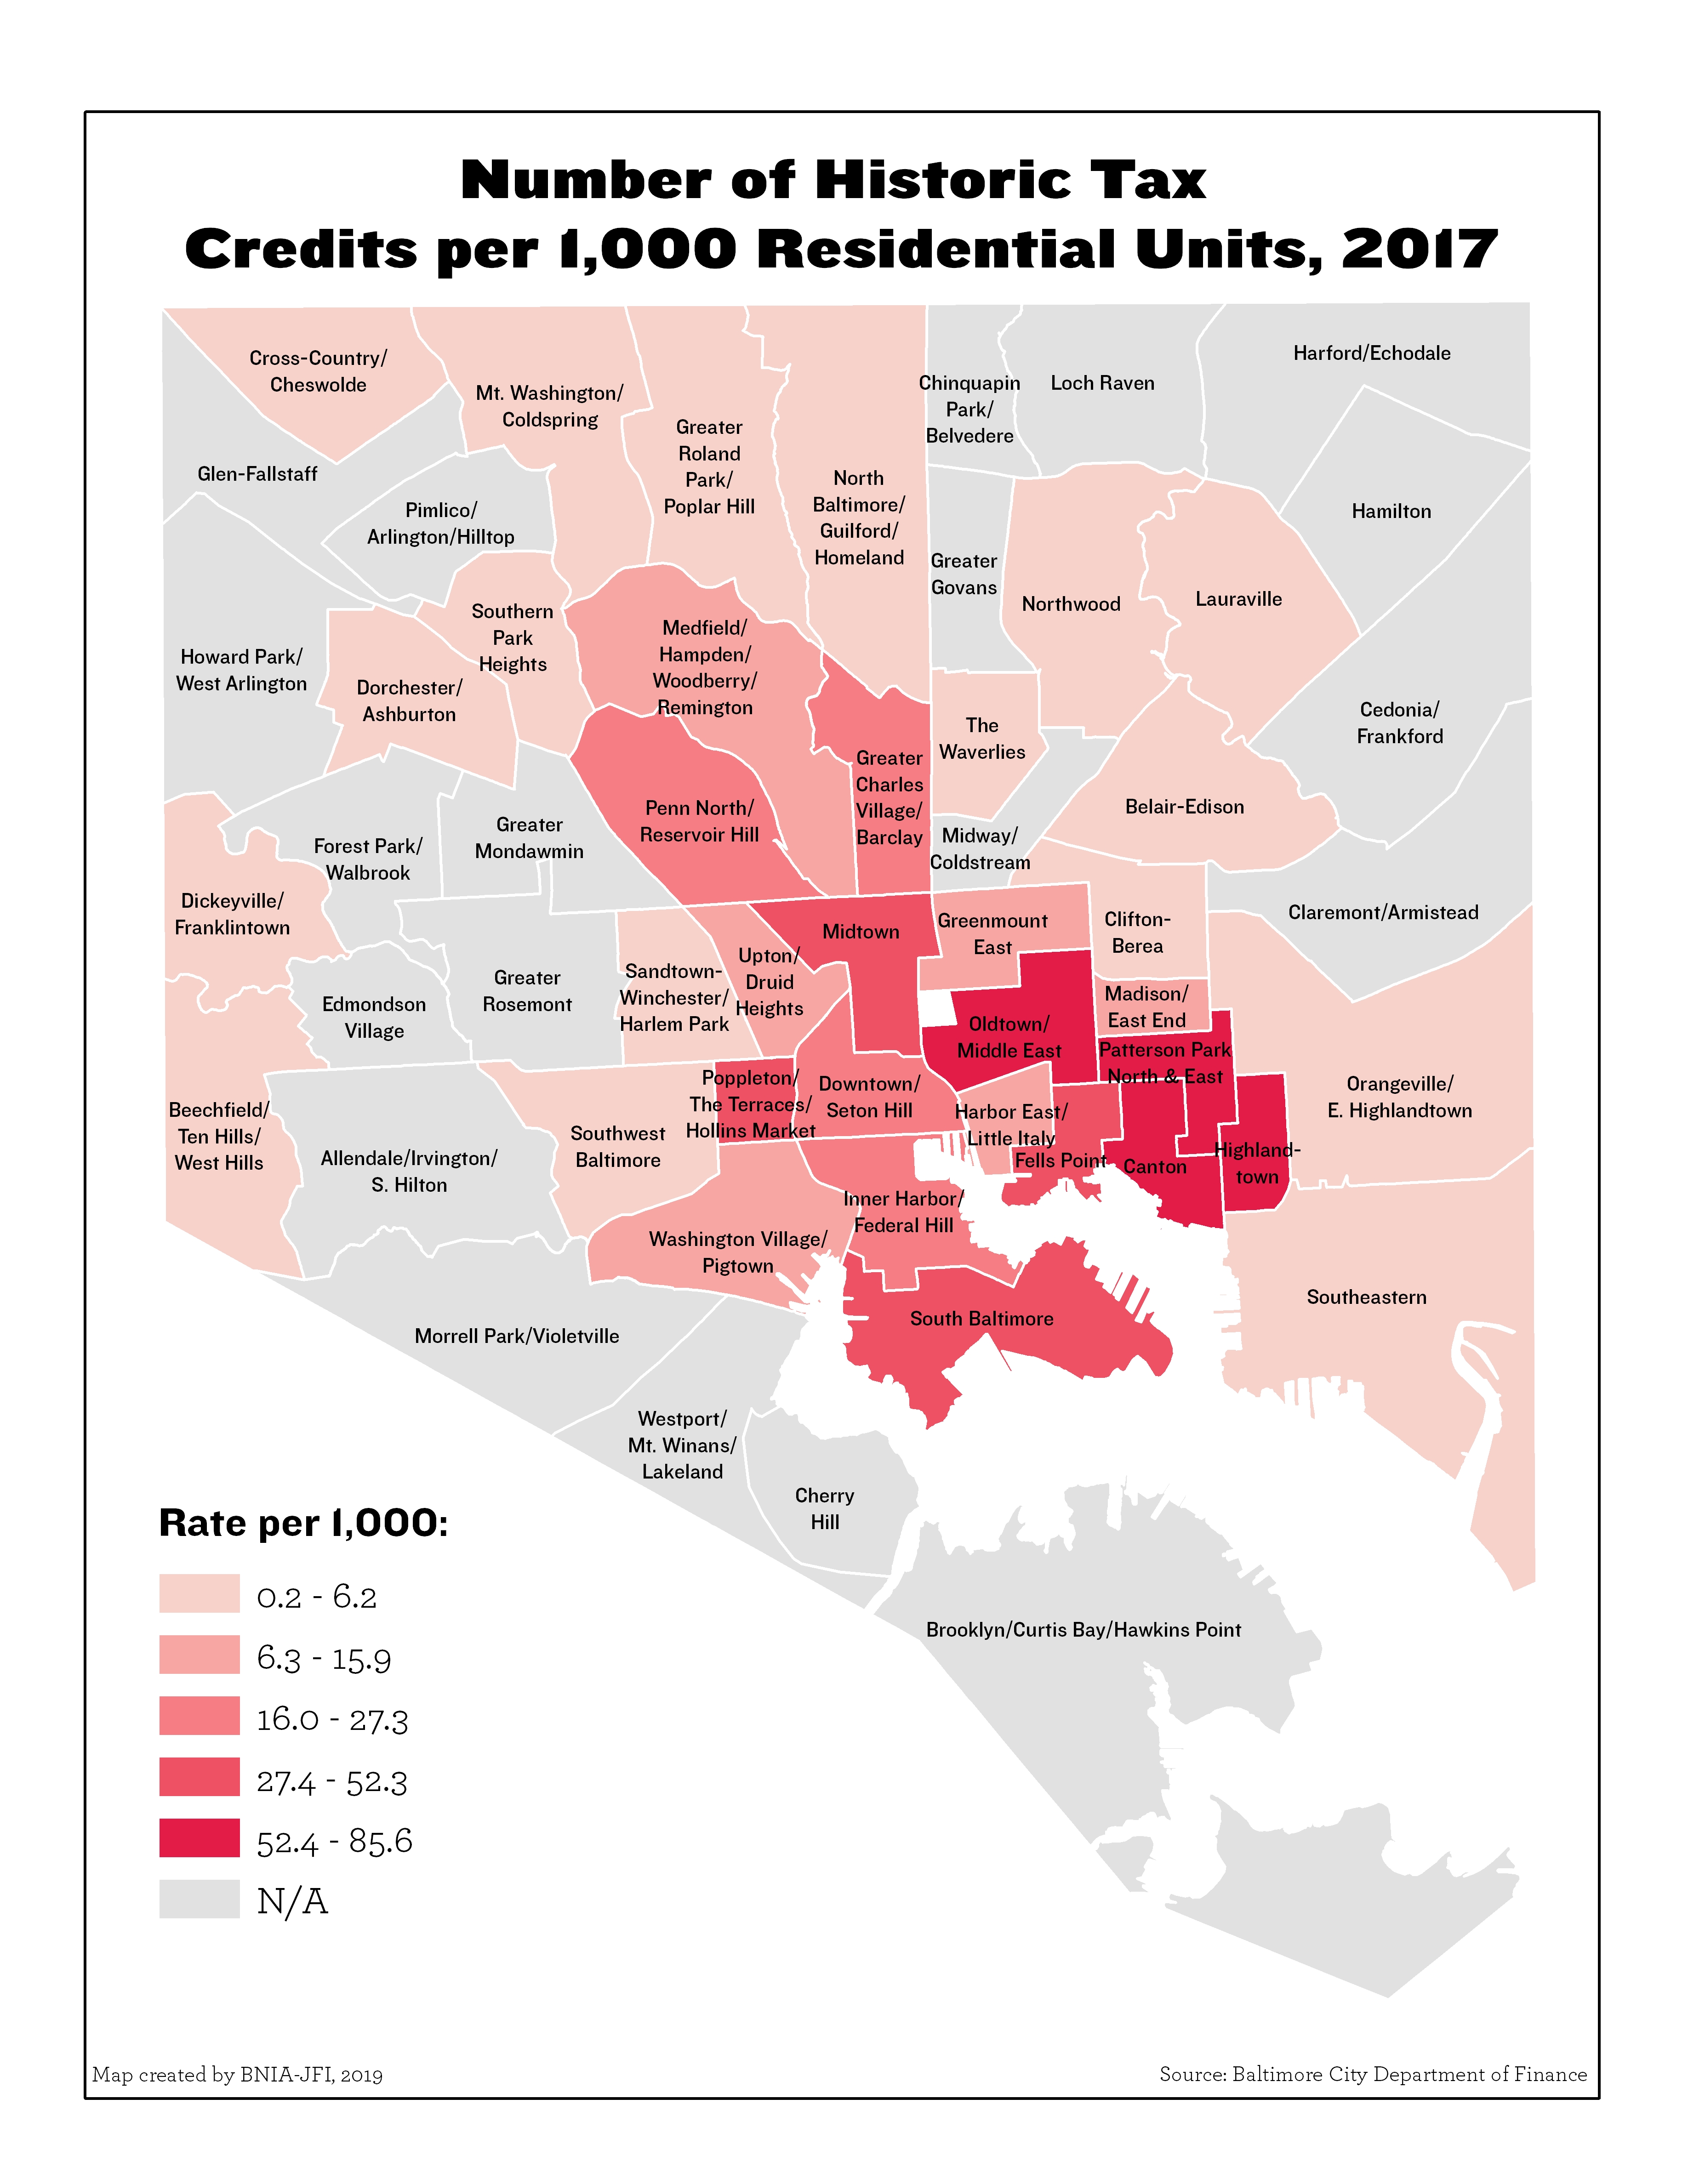
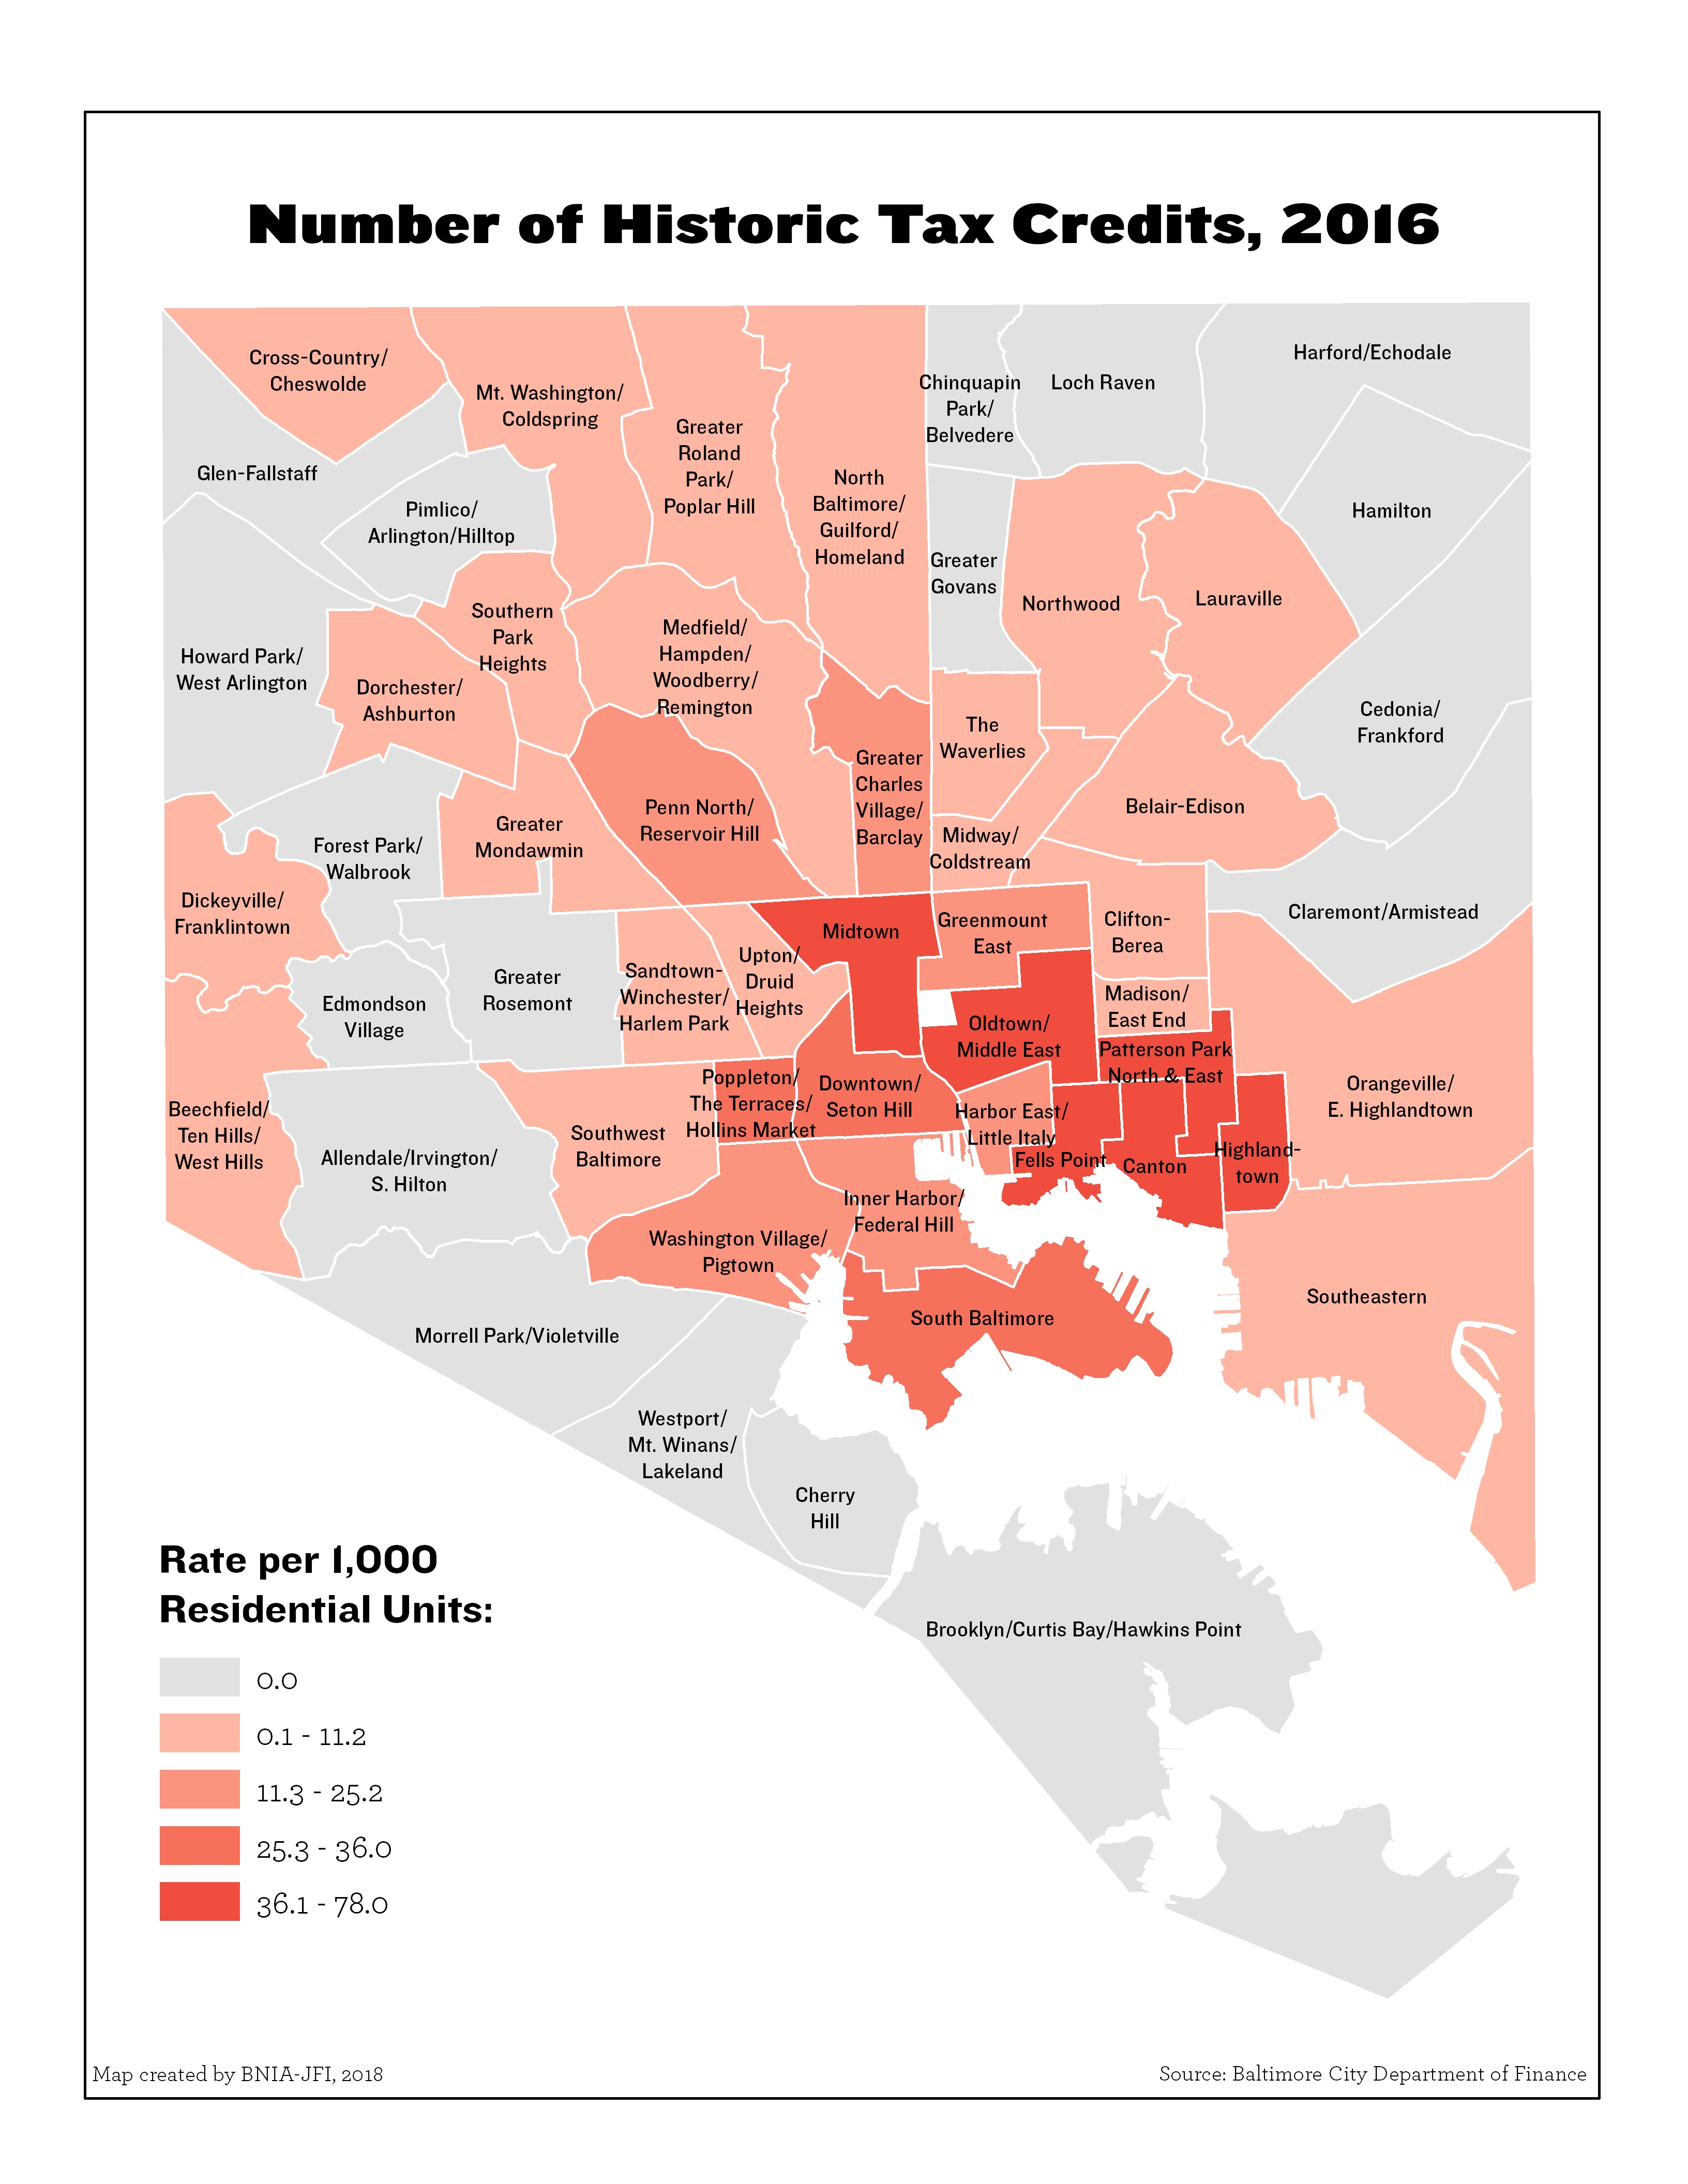
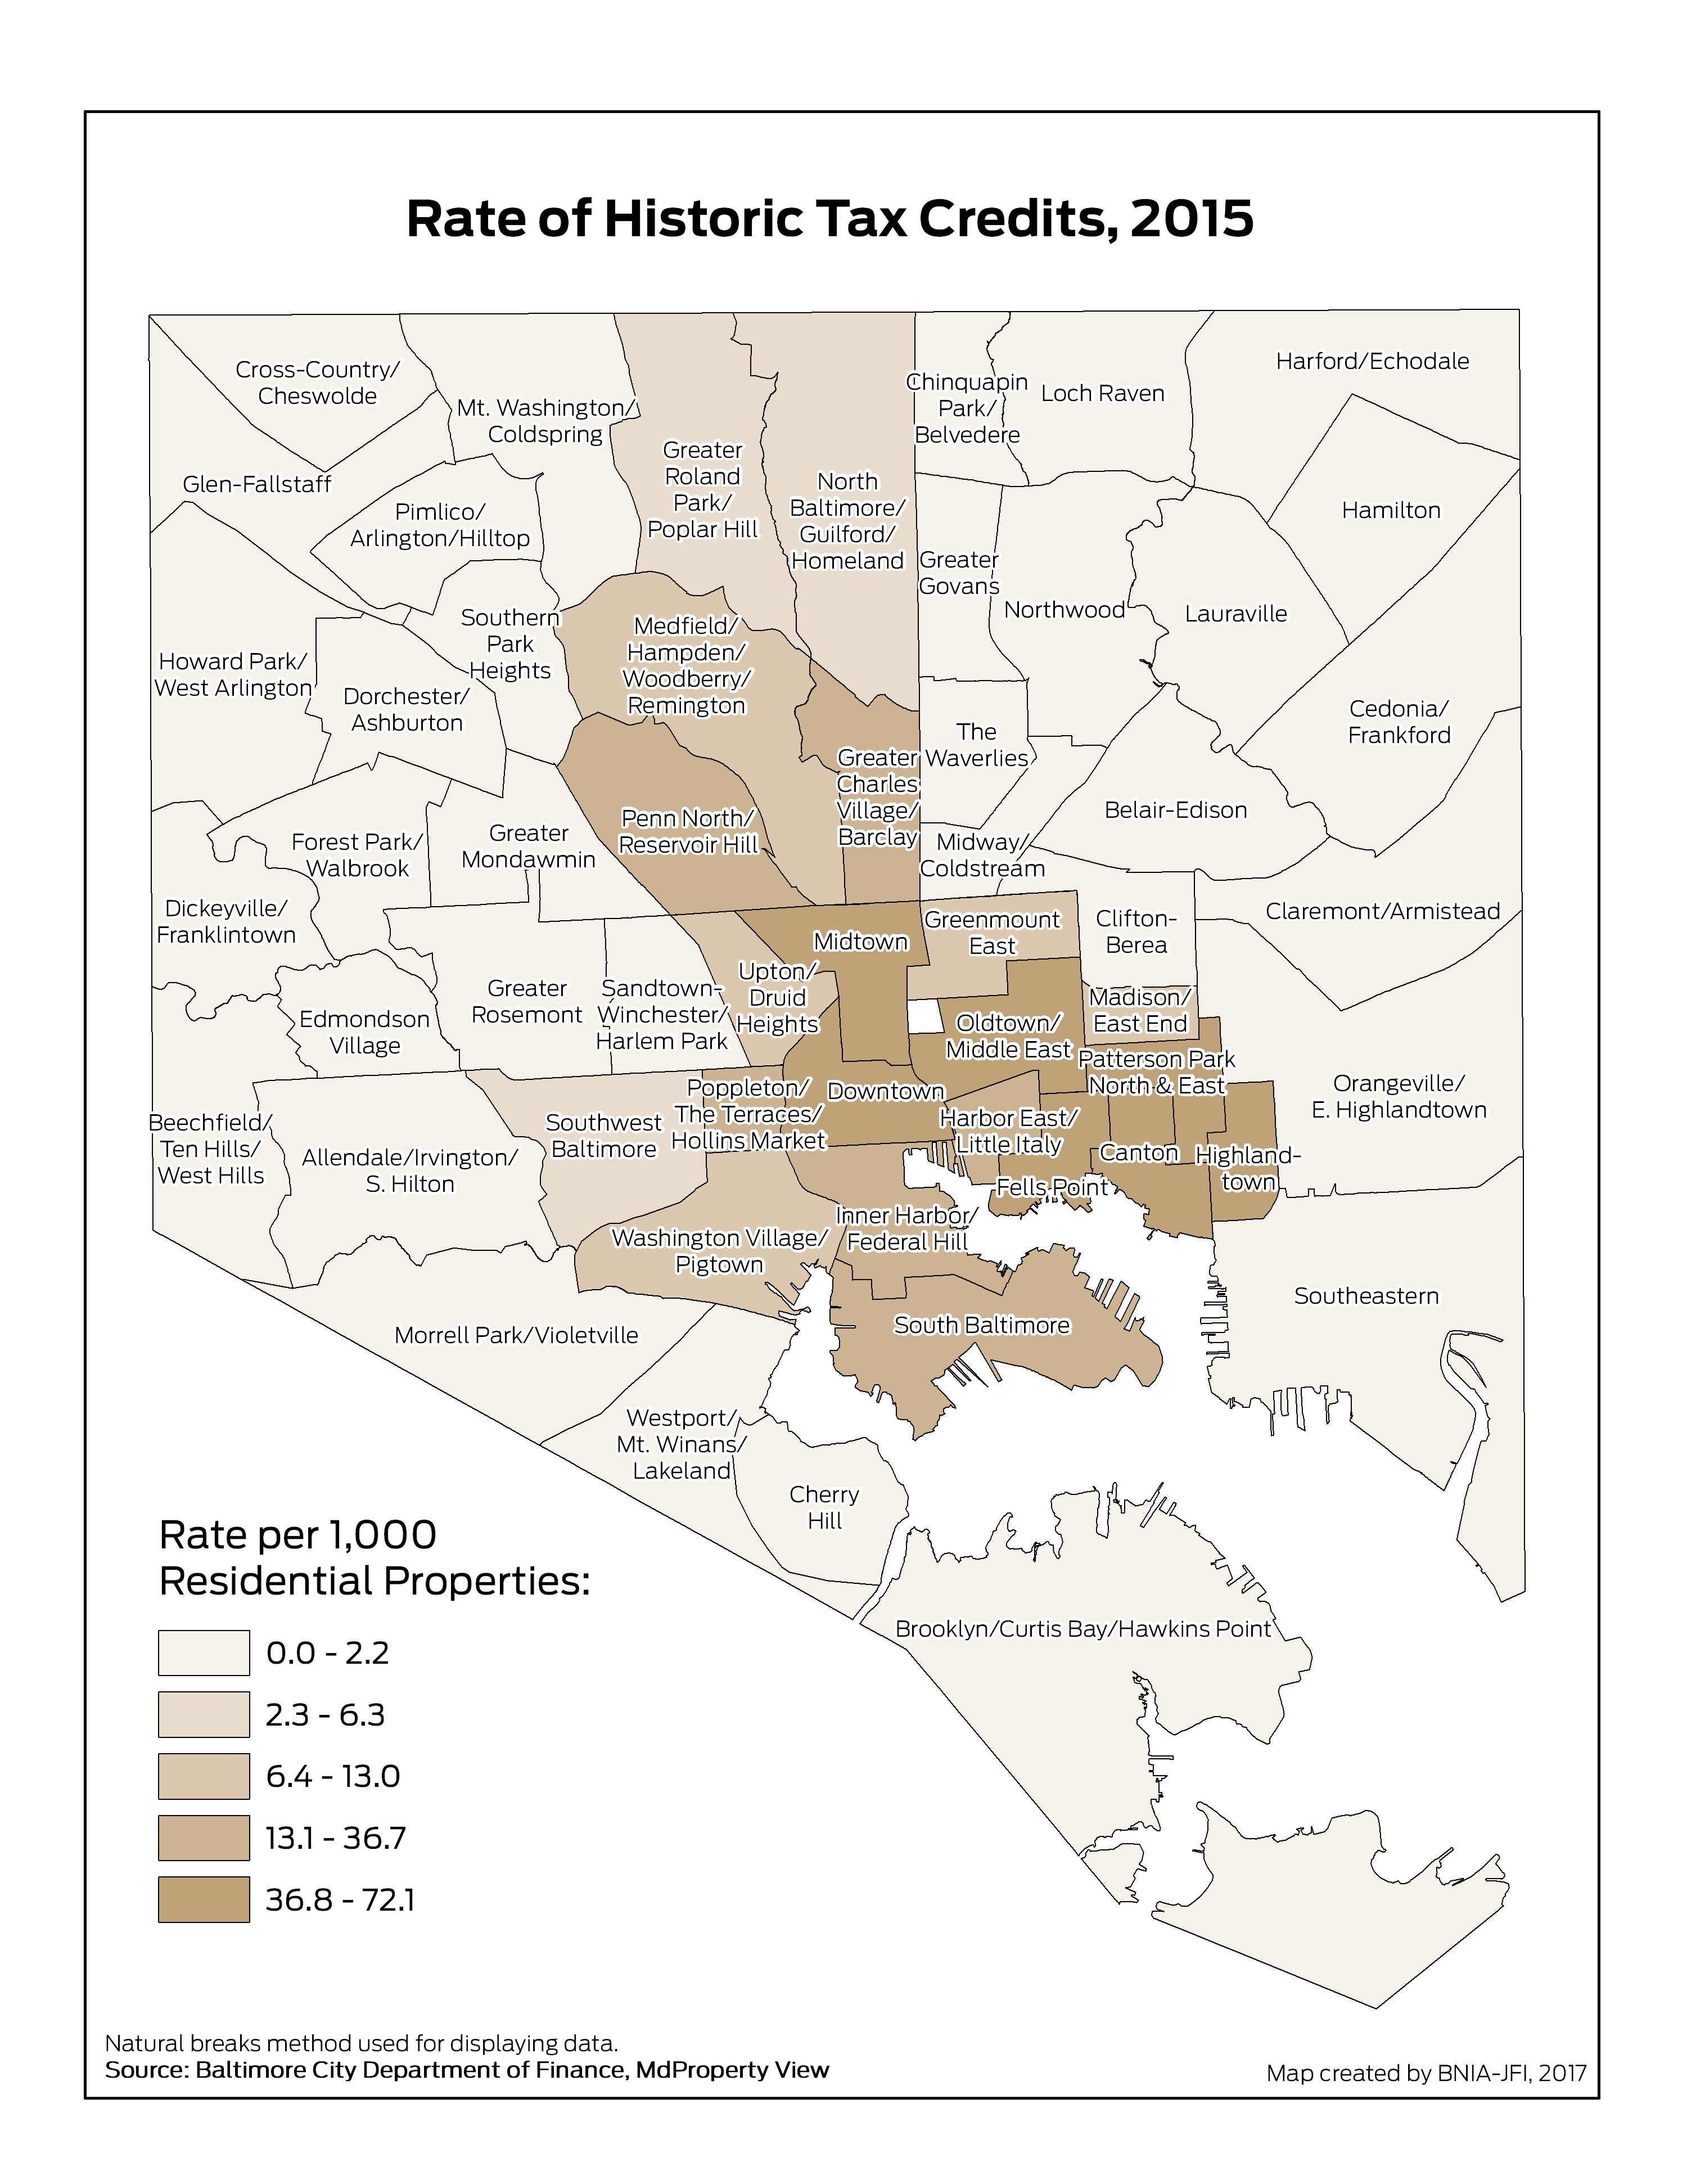
Number of Historic Tax Credits per 1,000 Residential Units
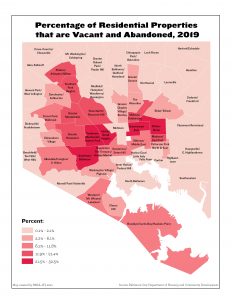
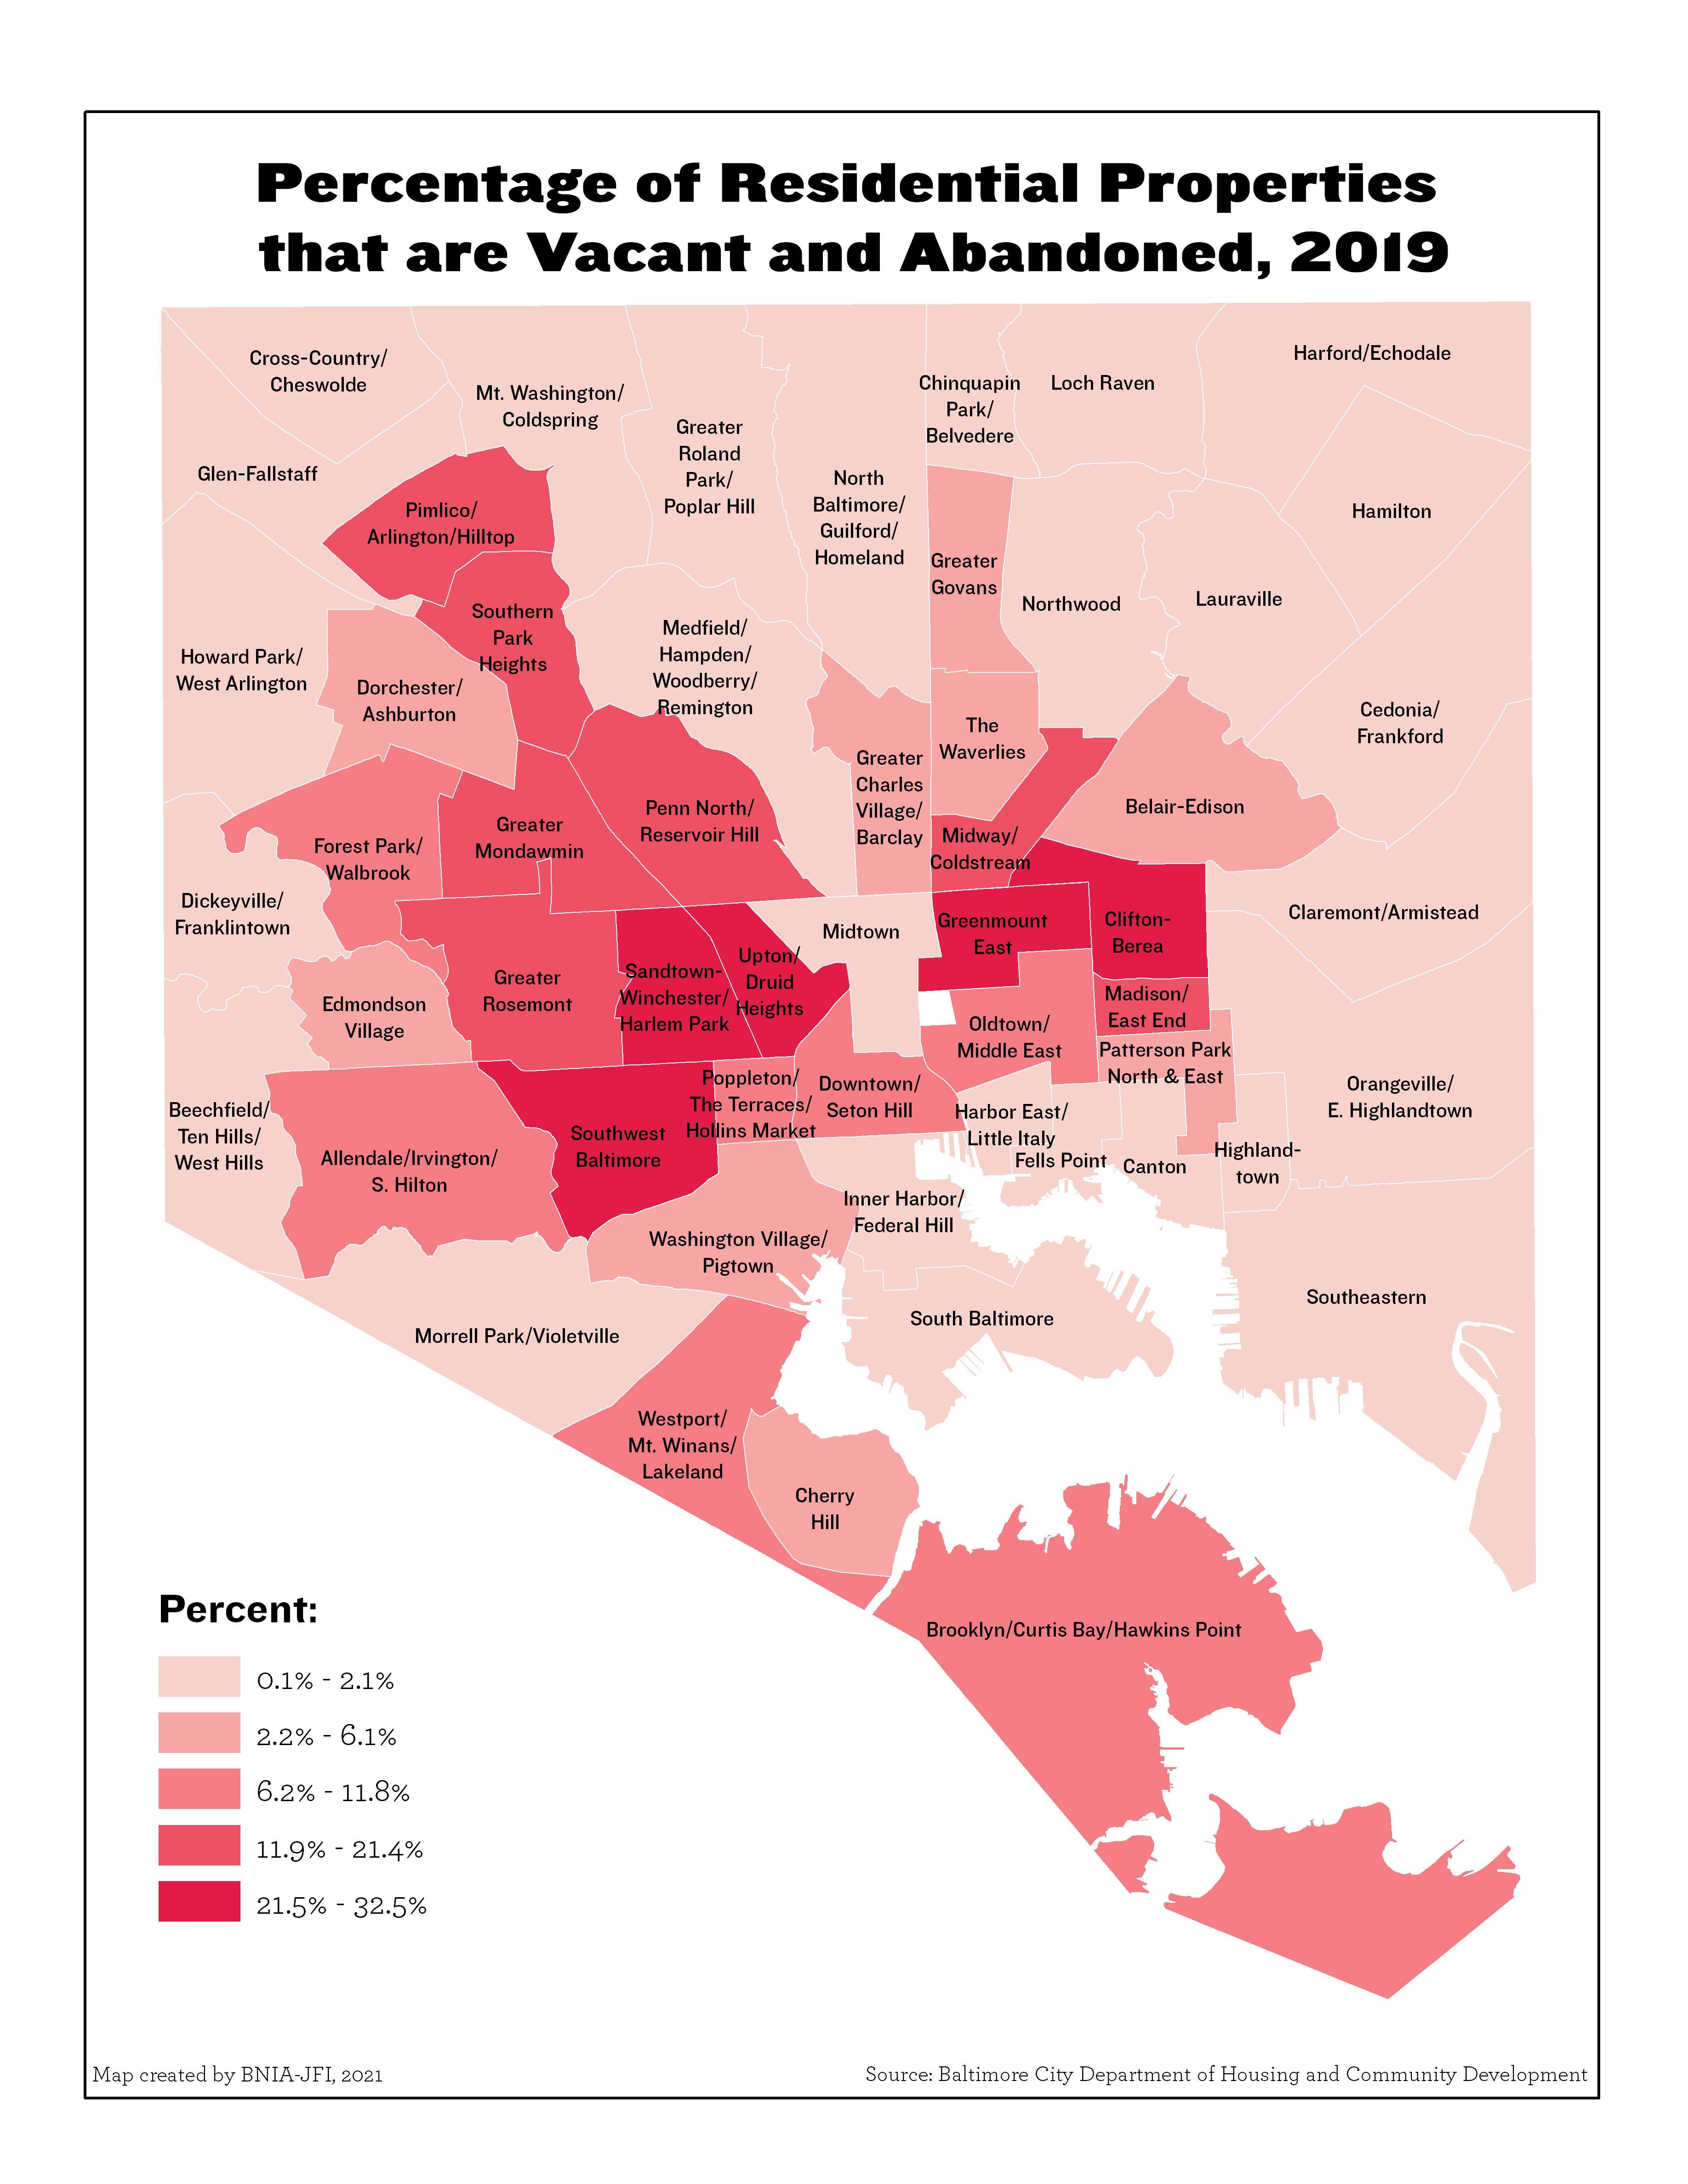
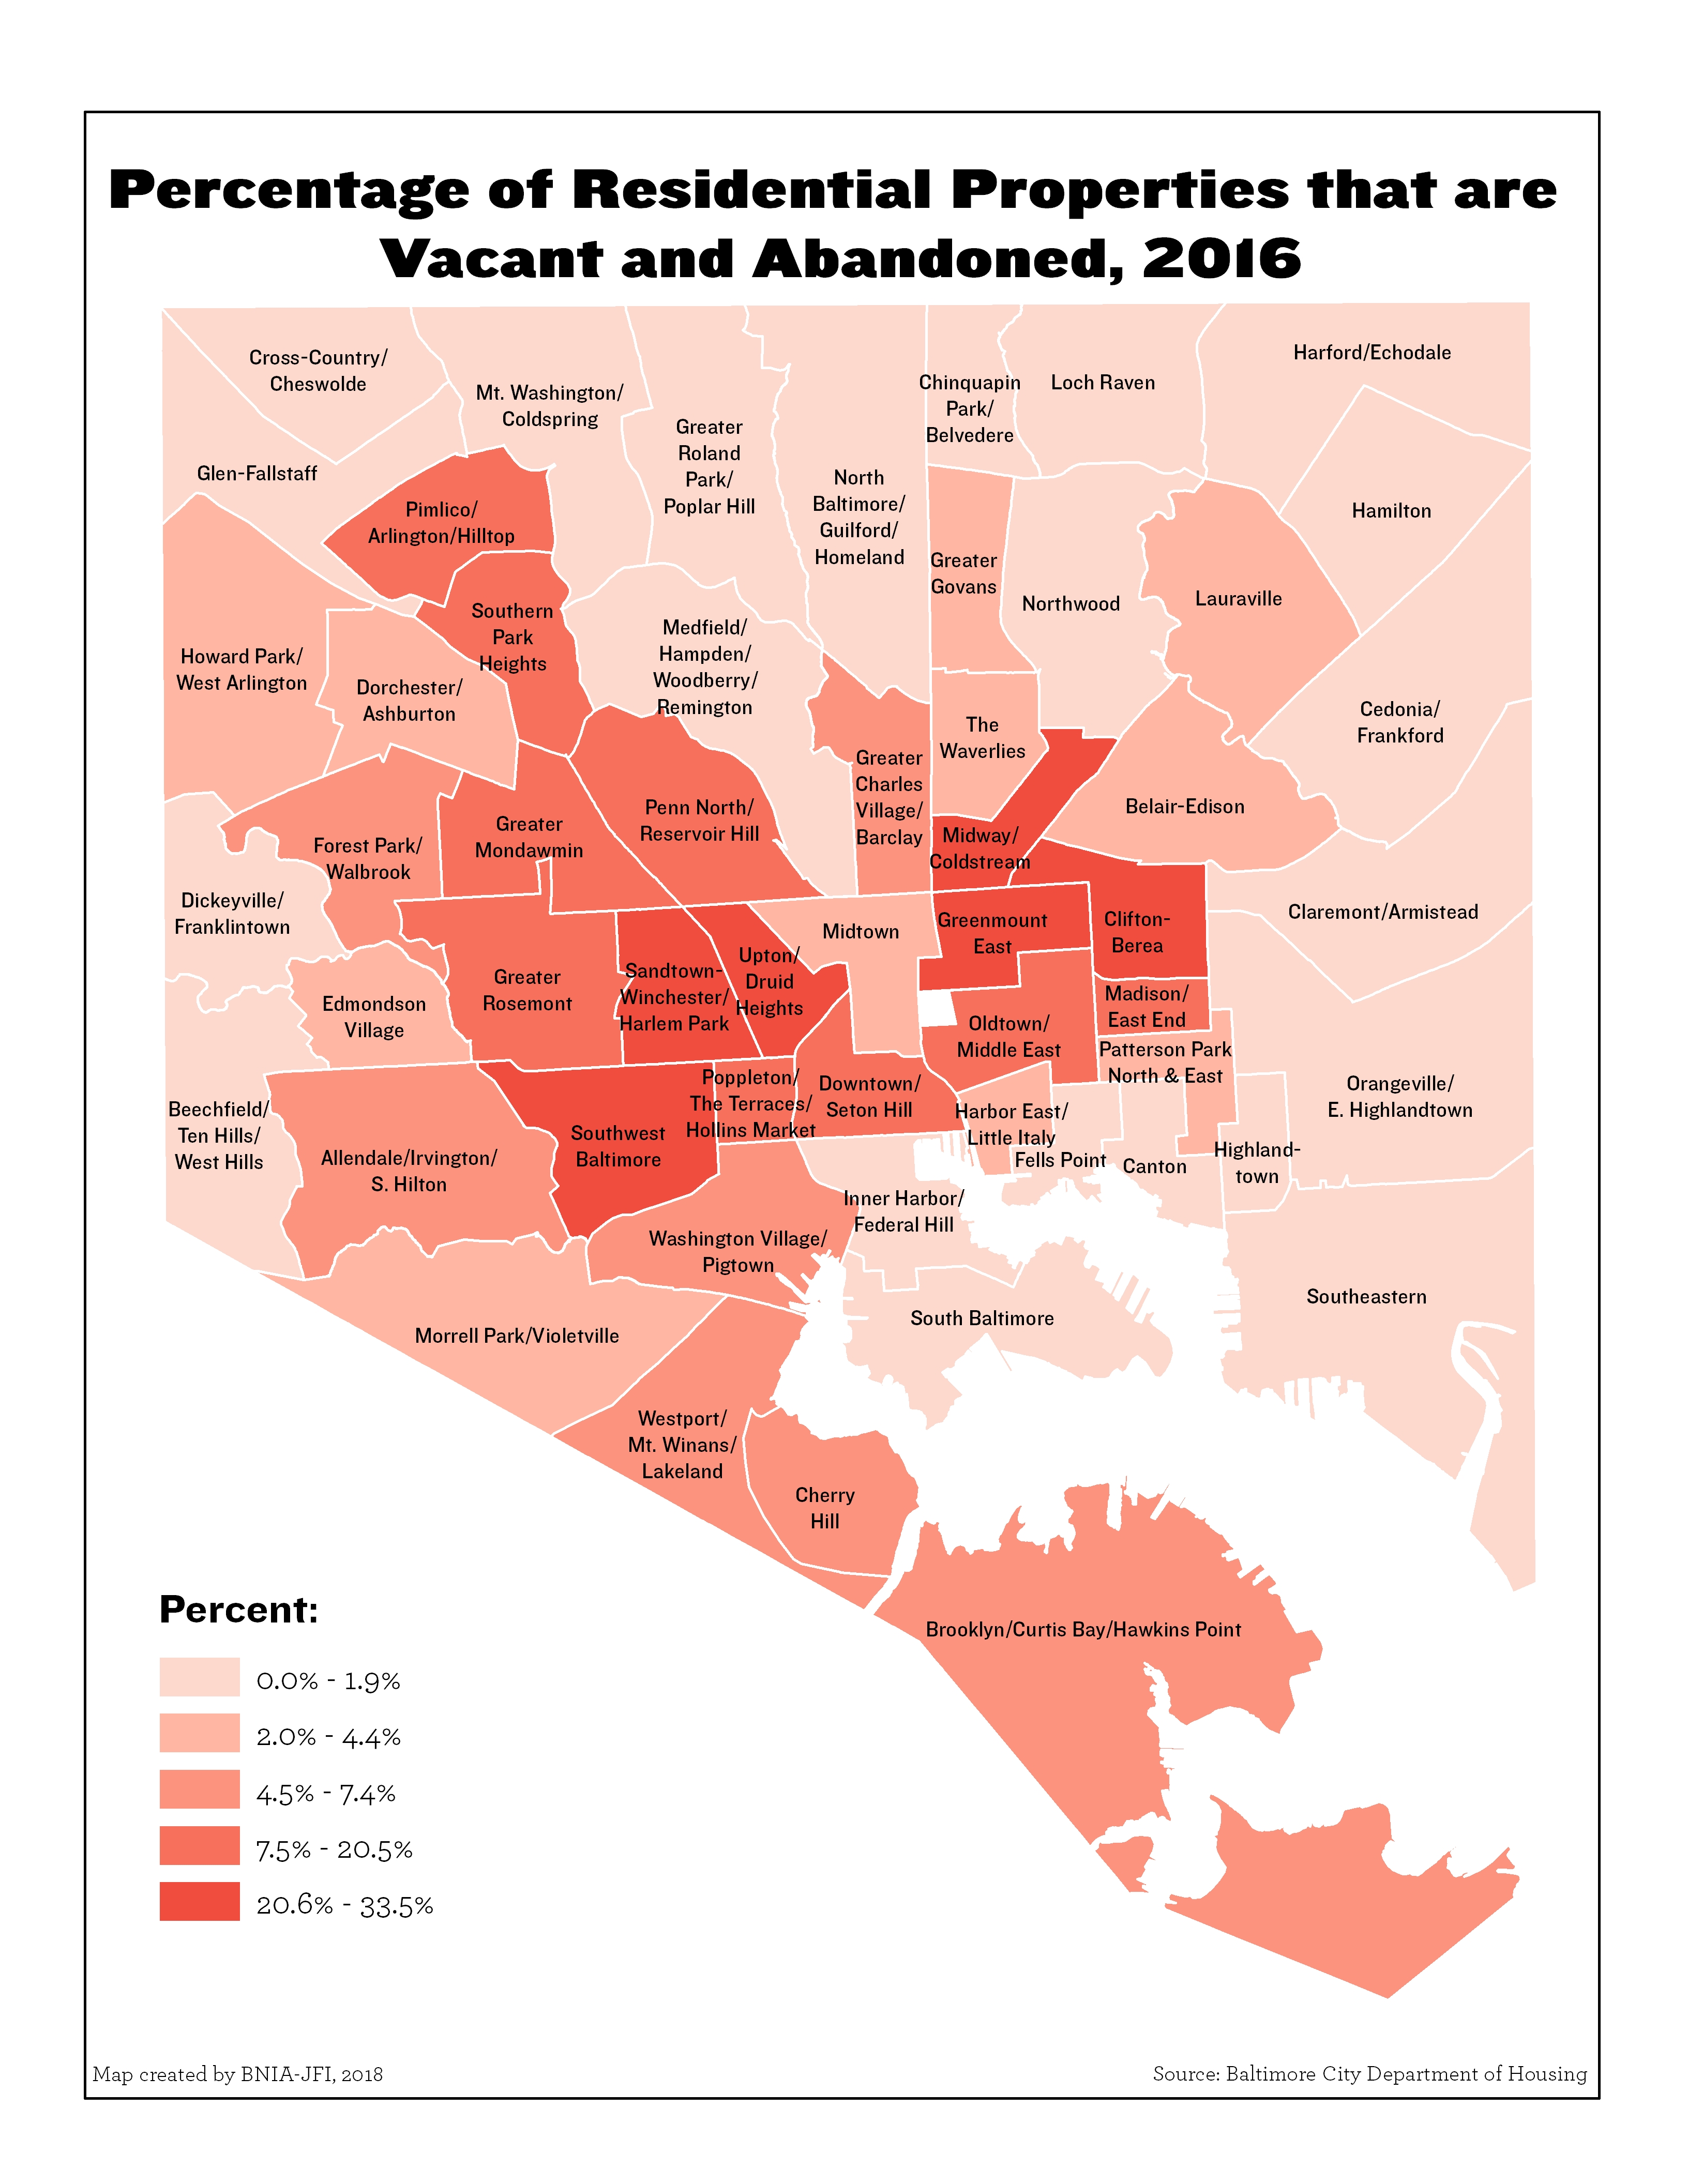
Percentage of Residential Properties that are Vacant and Abandoned (2019)
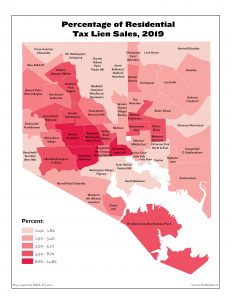
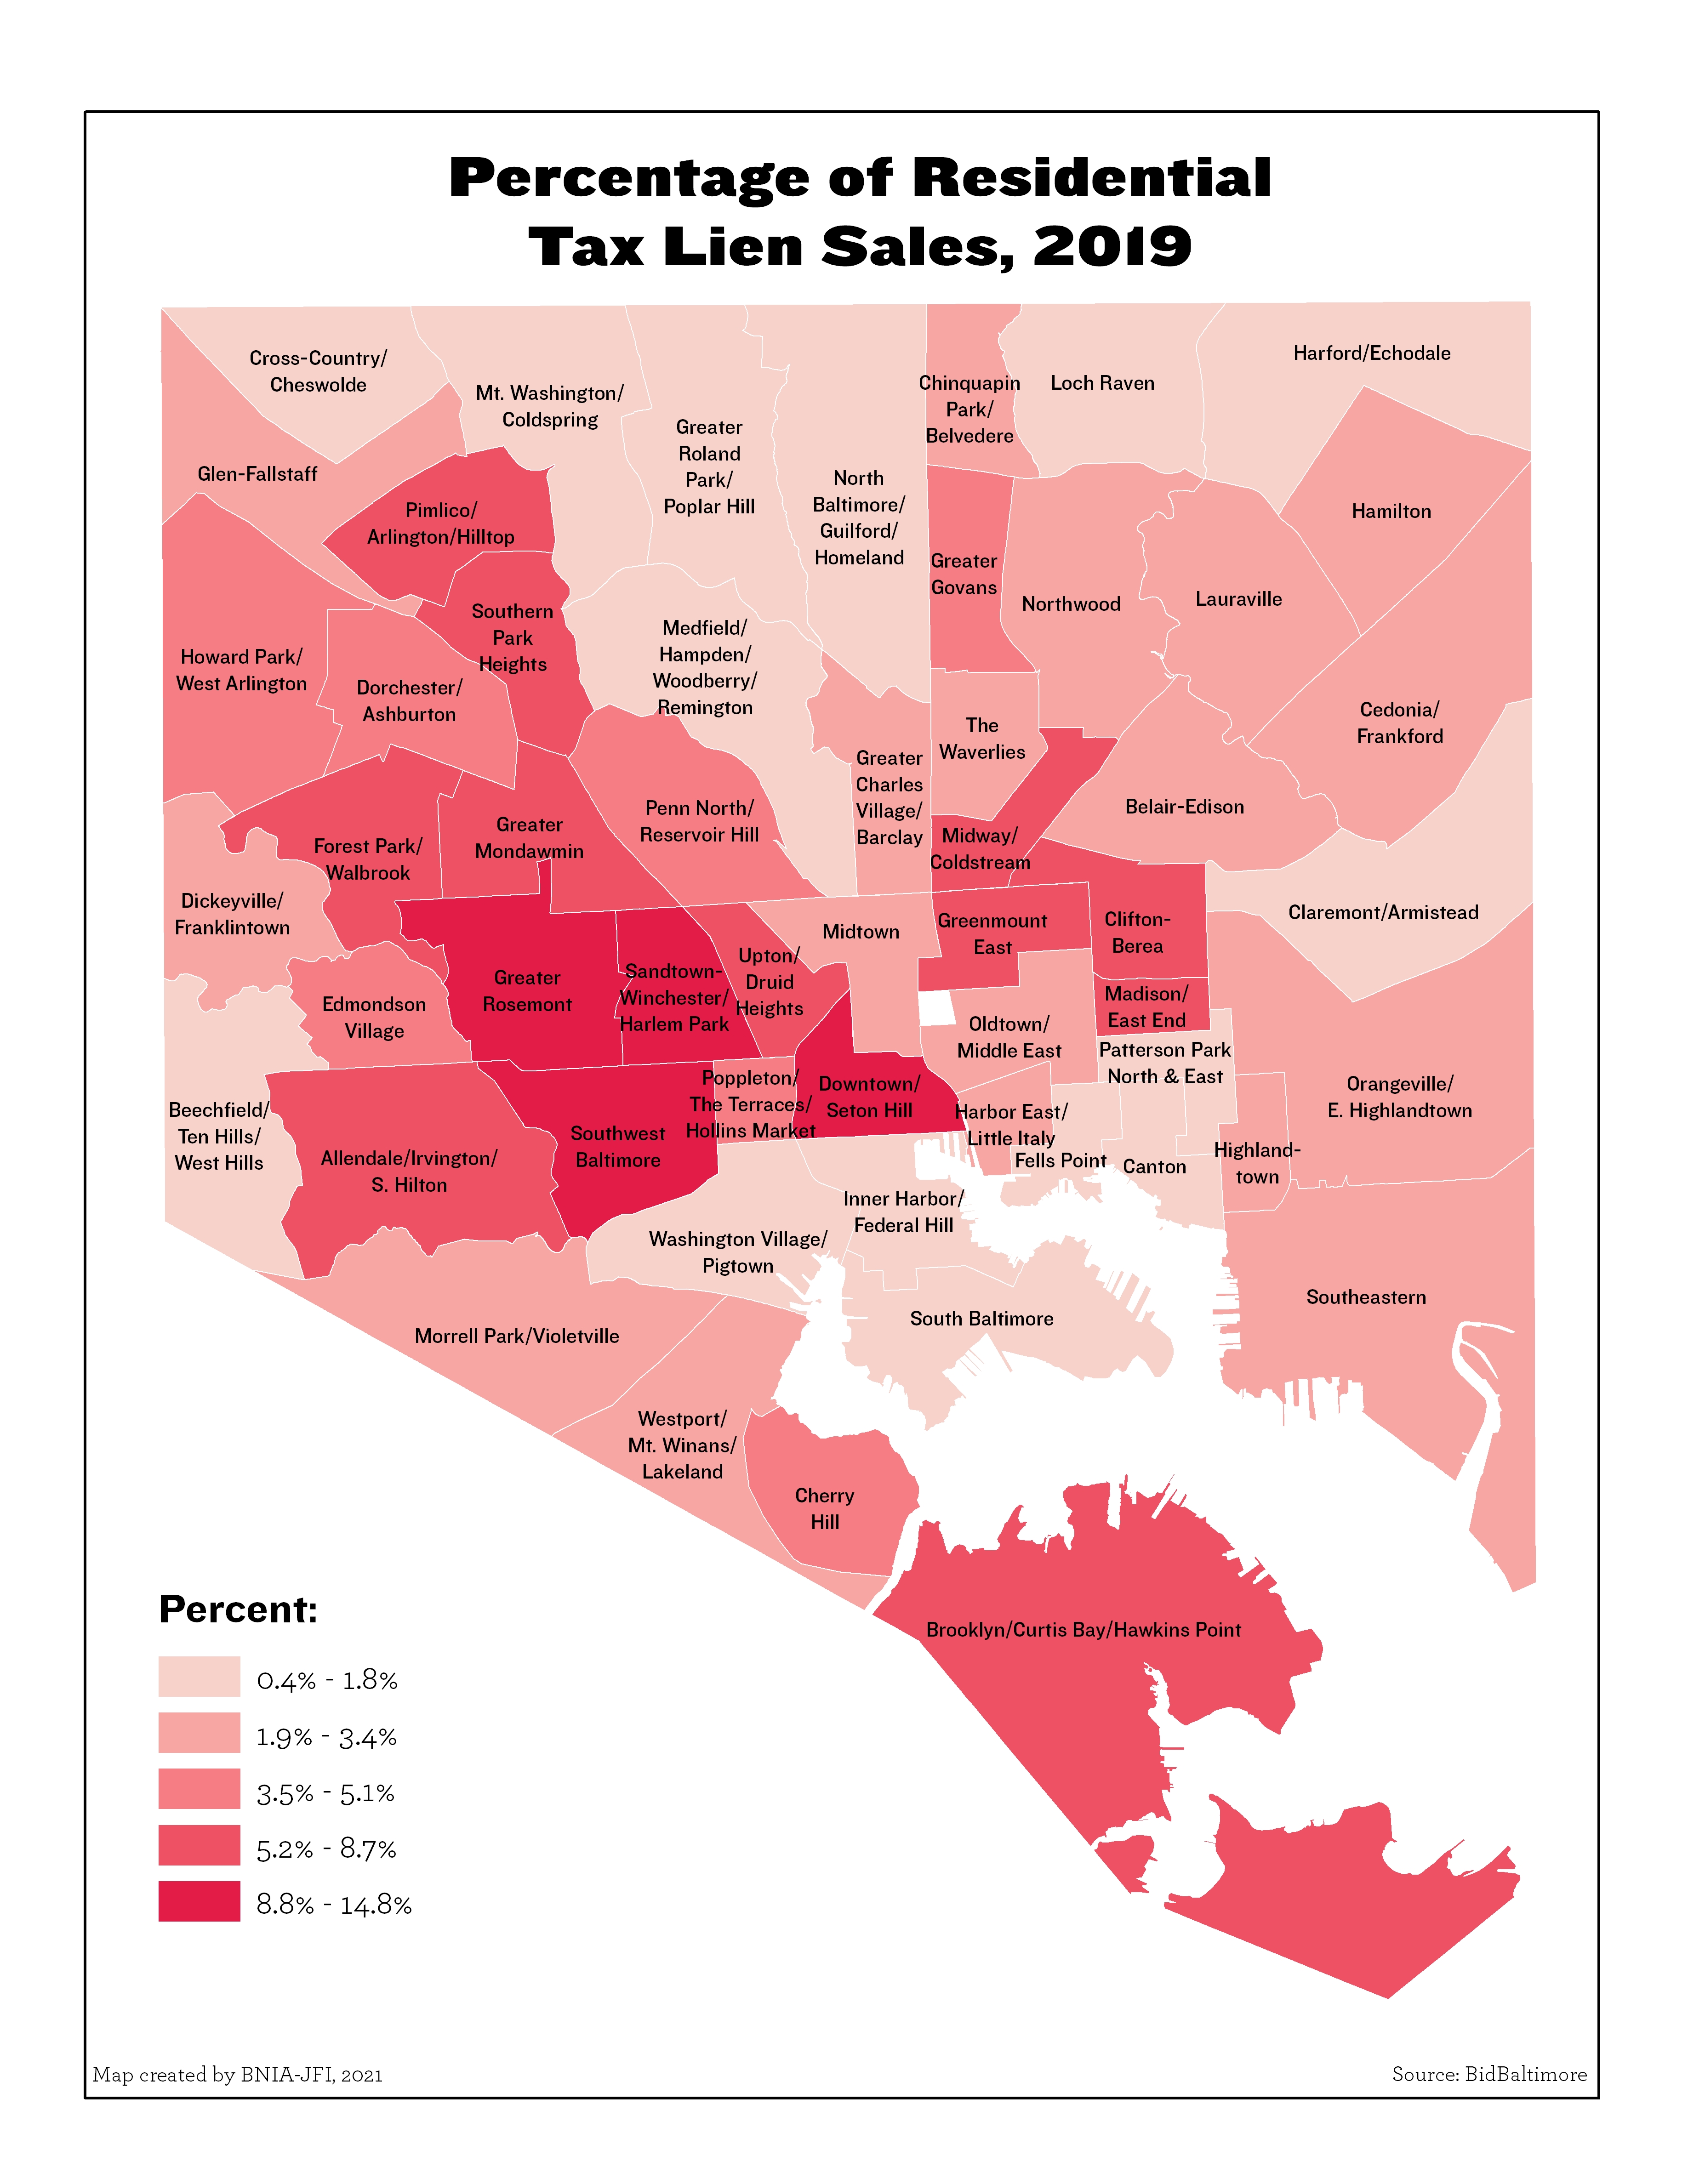
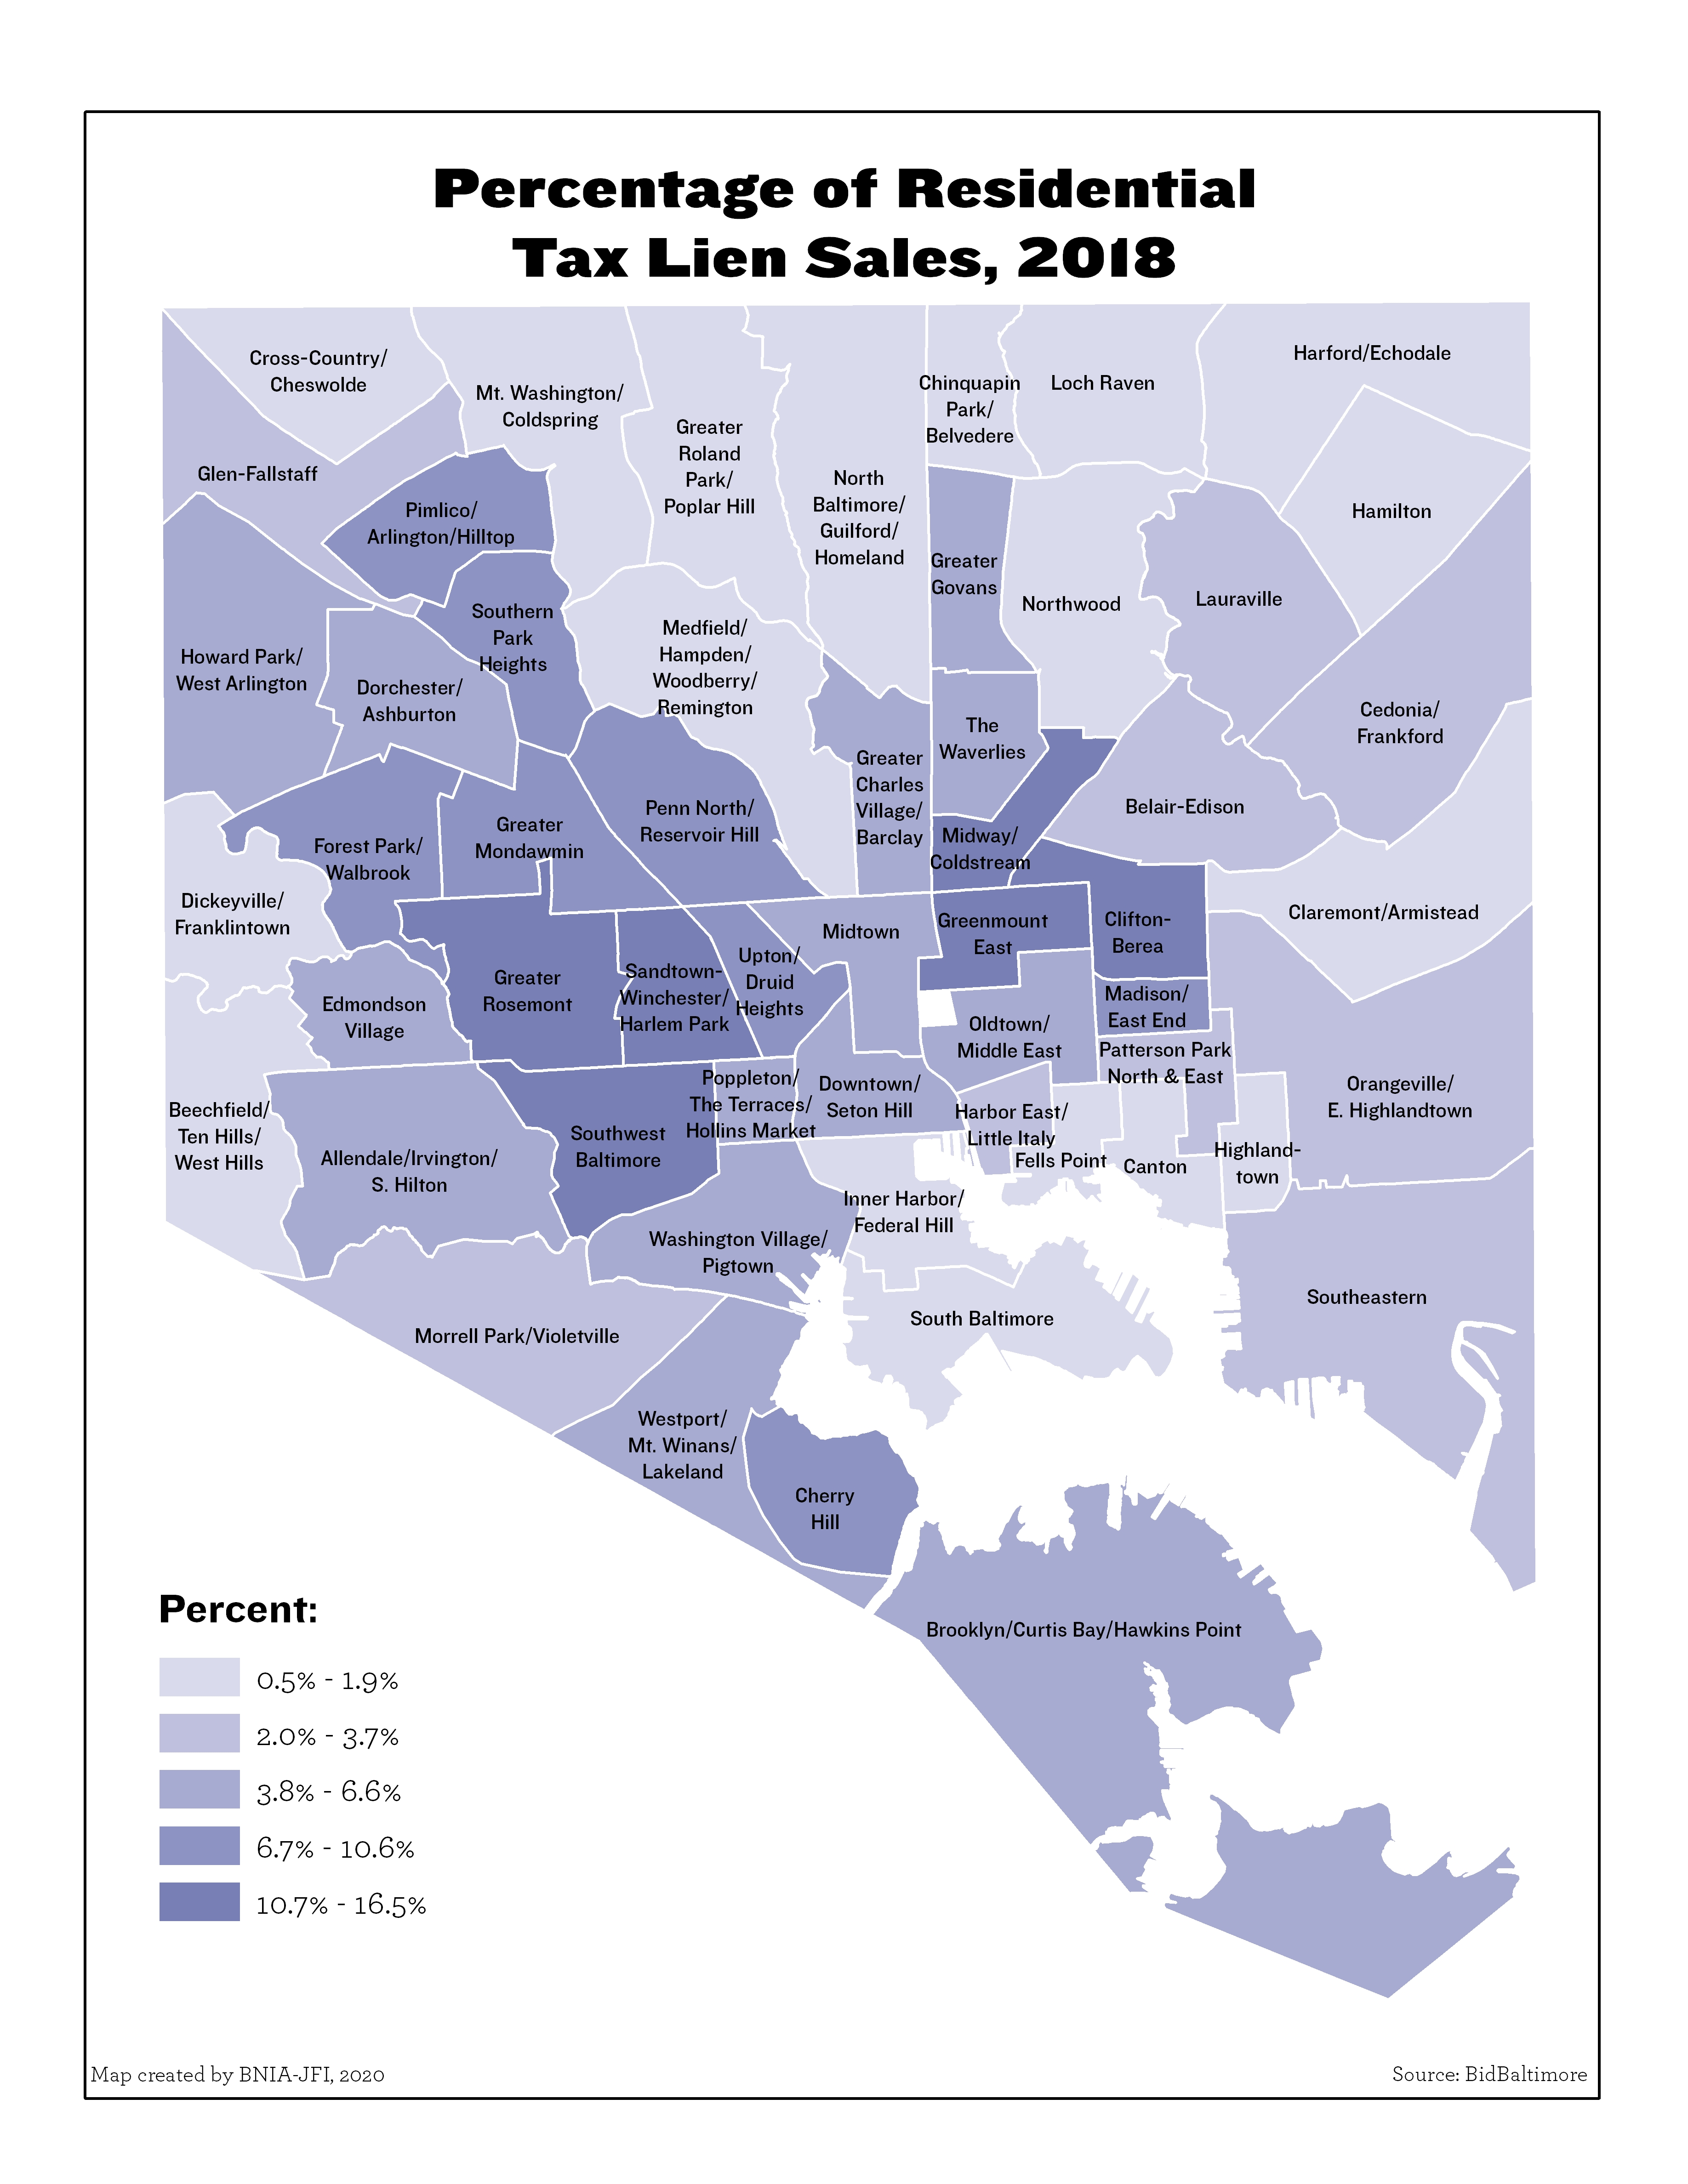
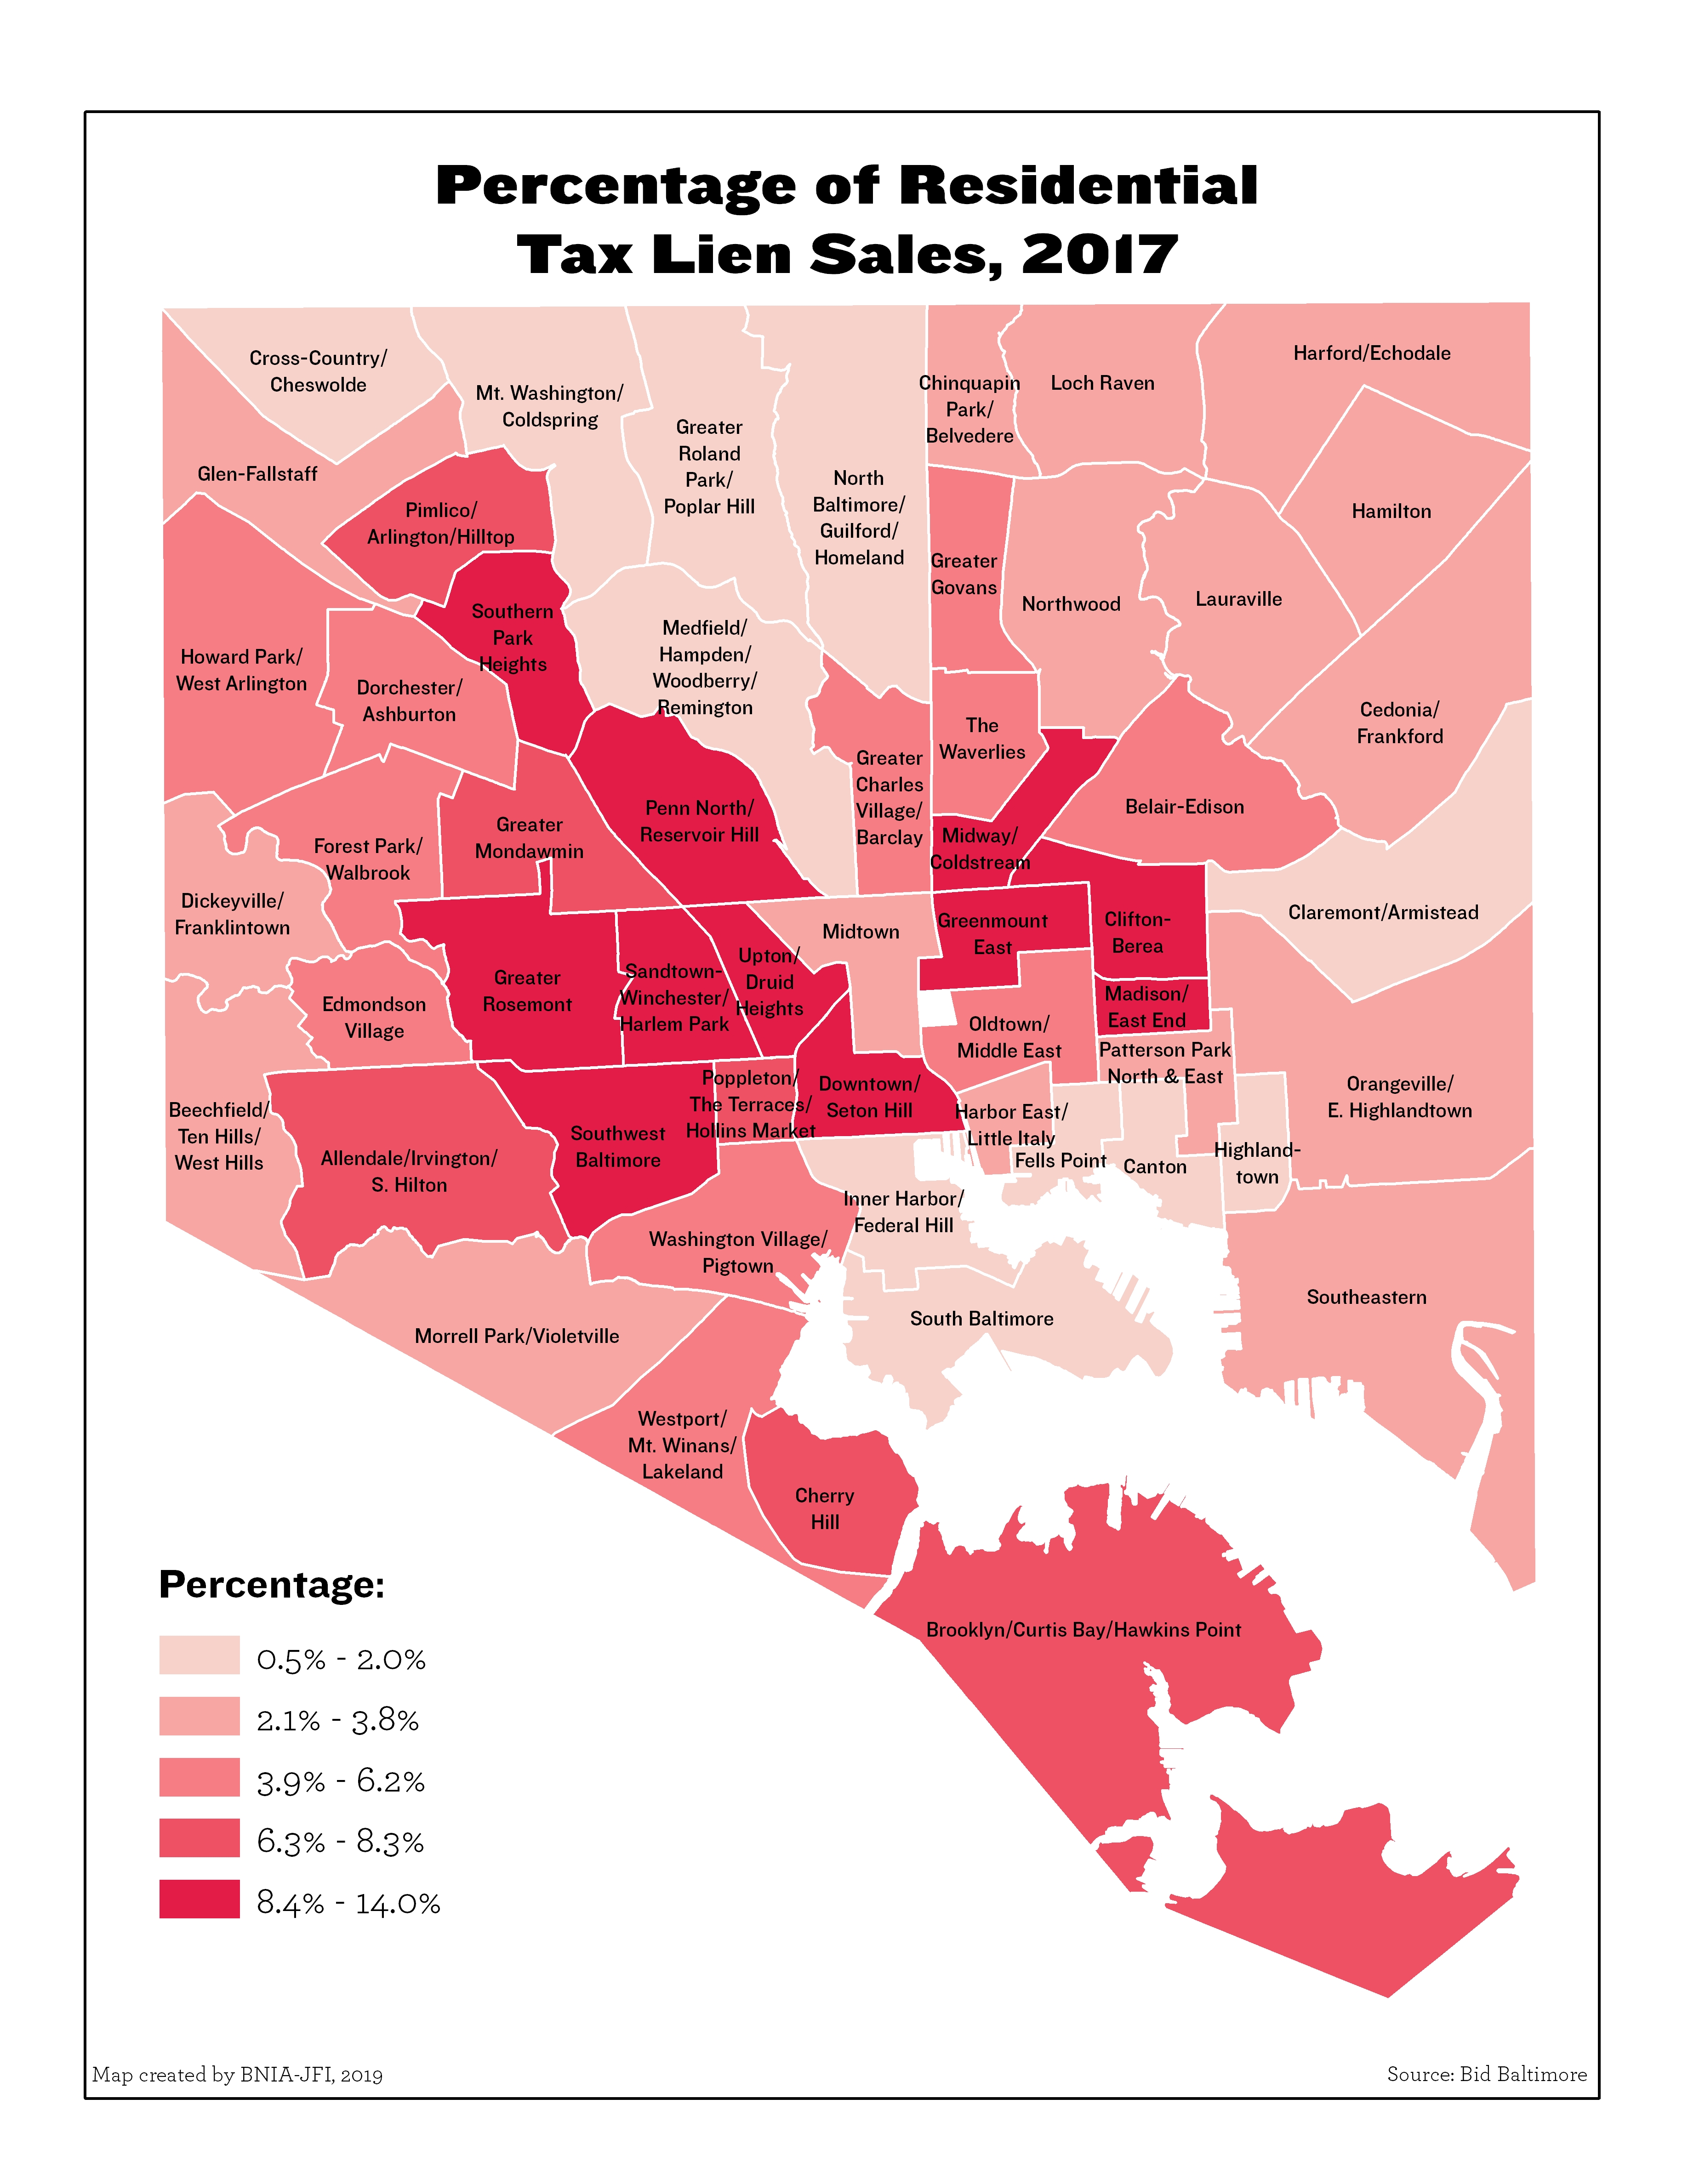
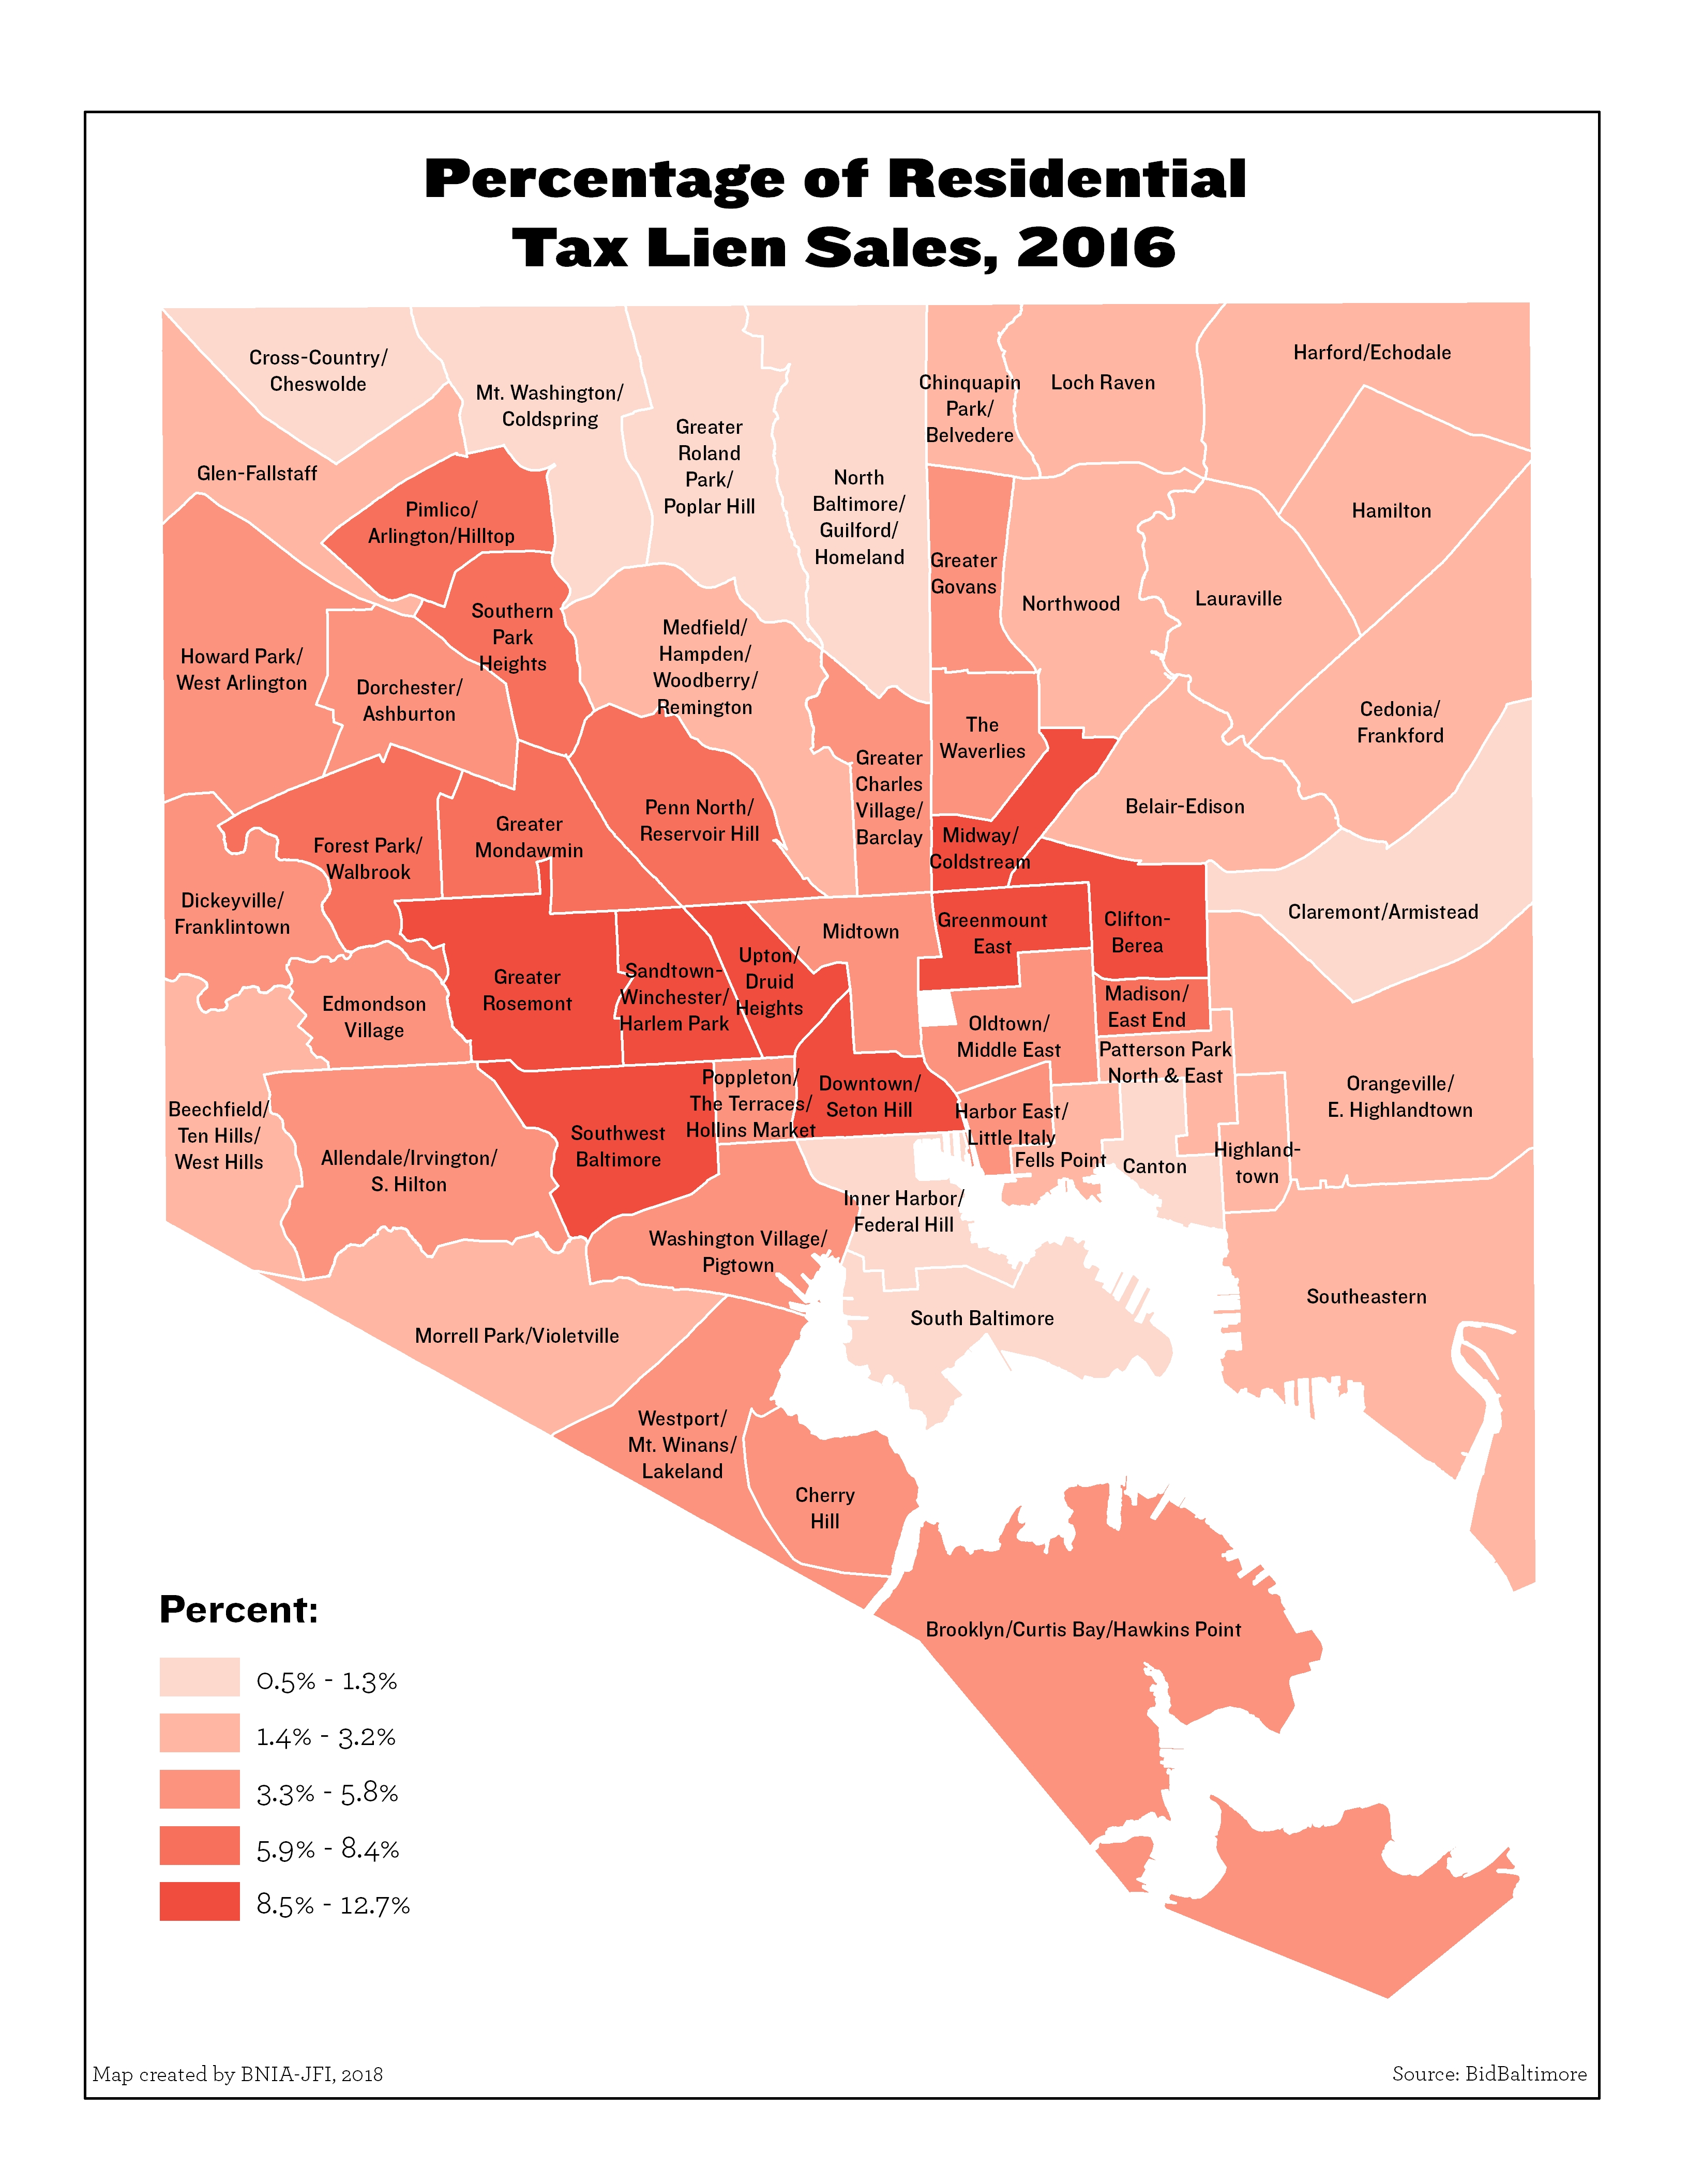
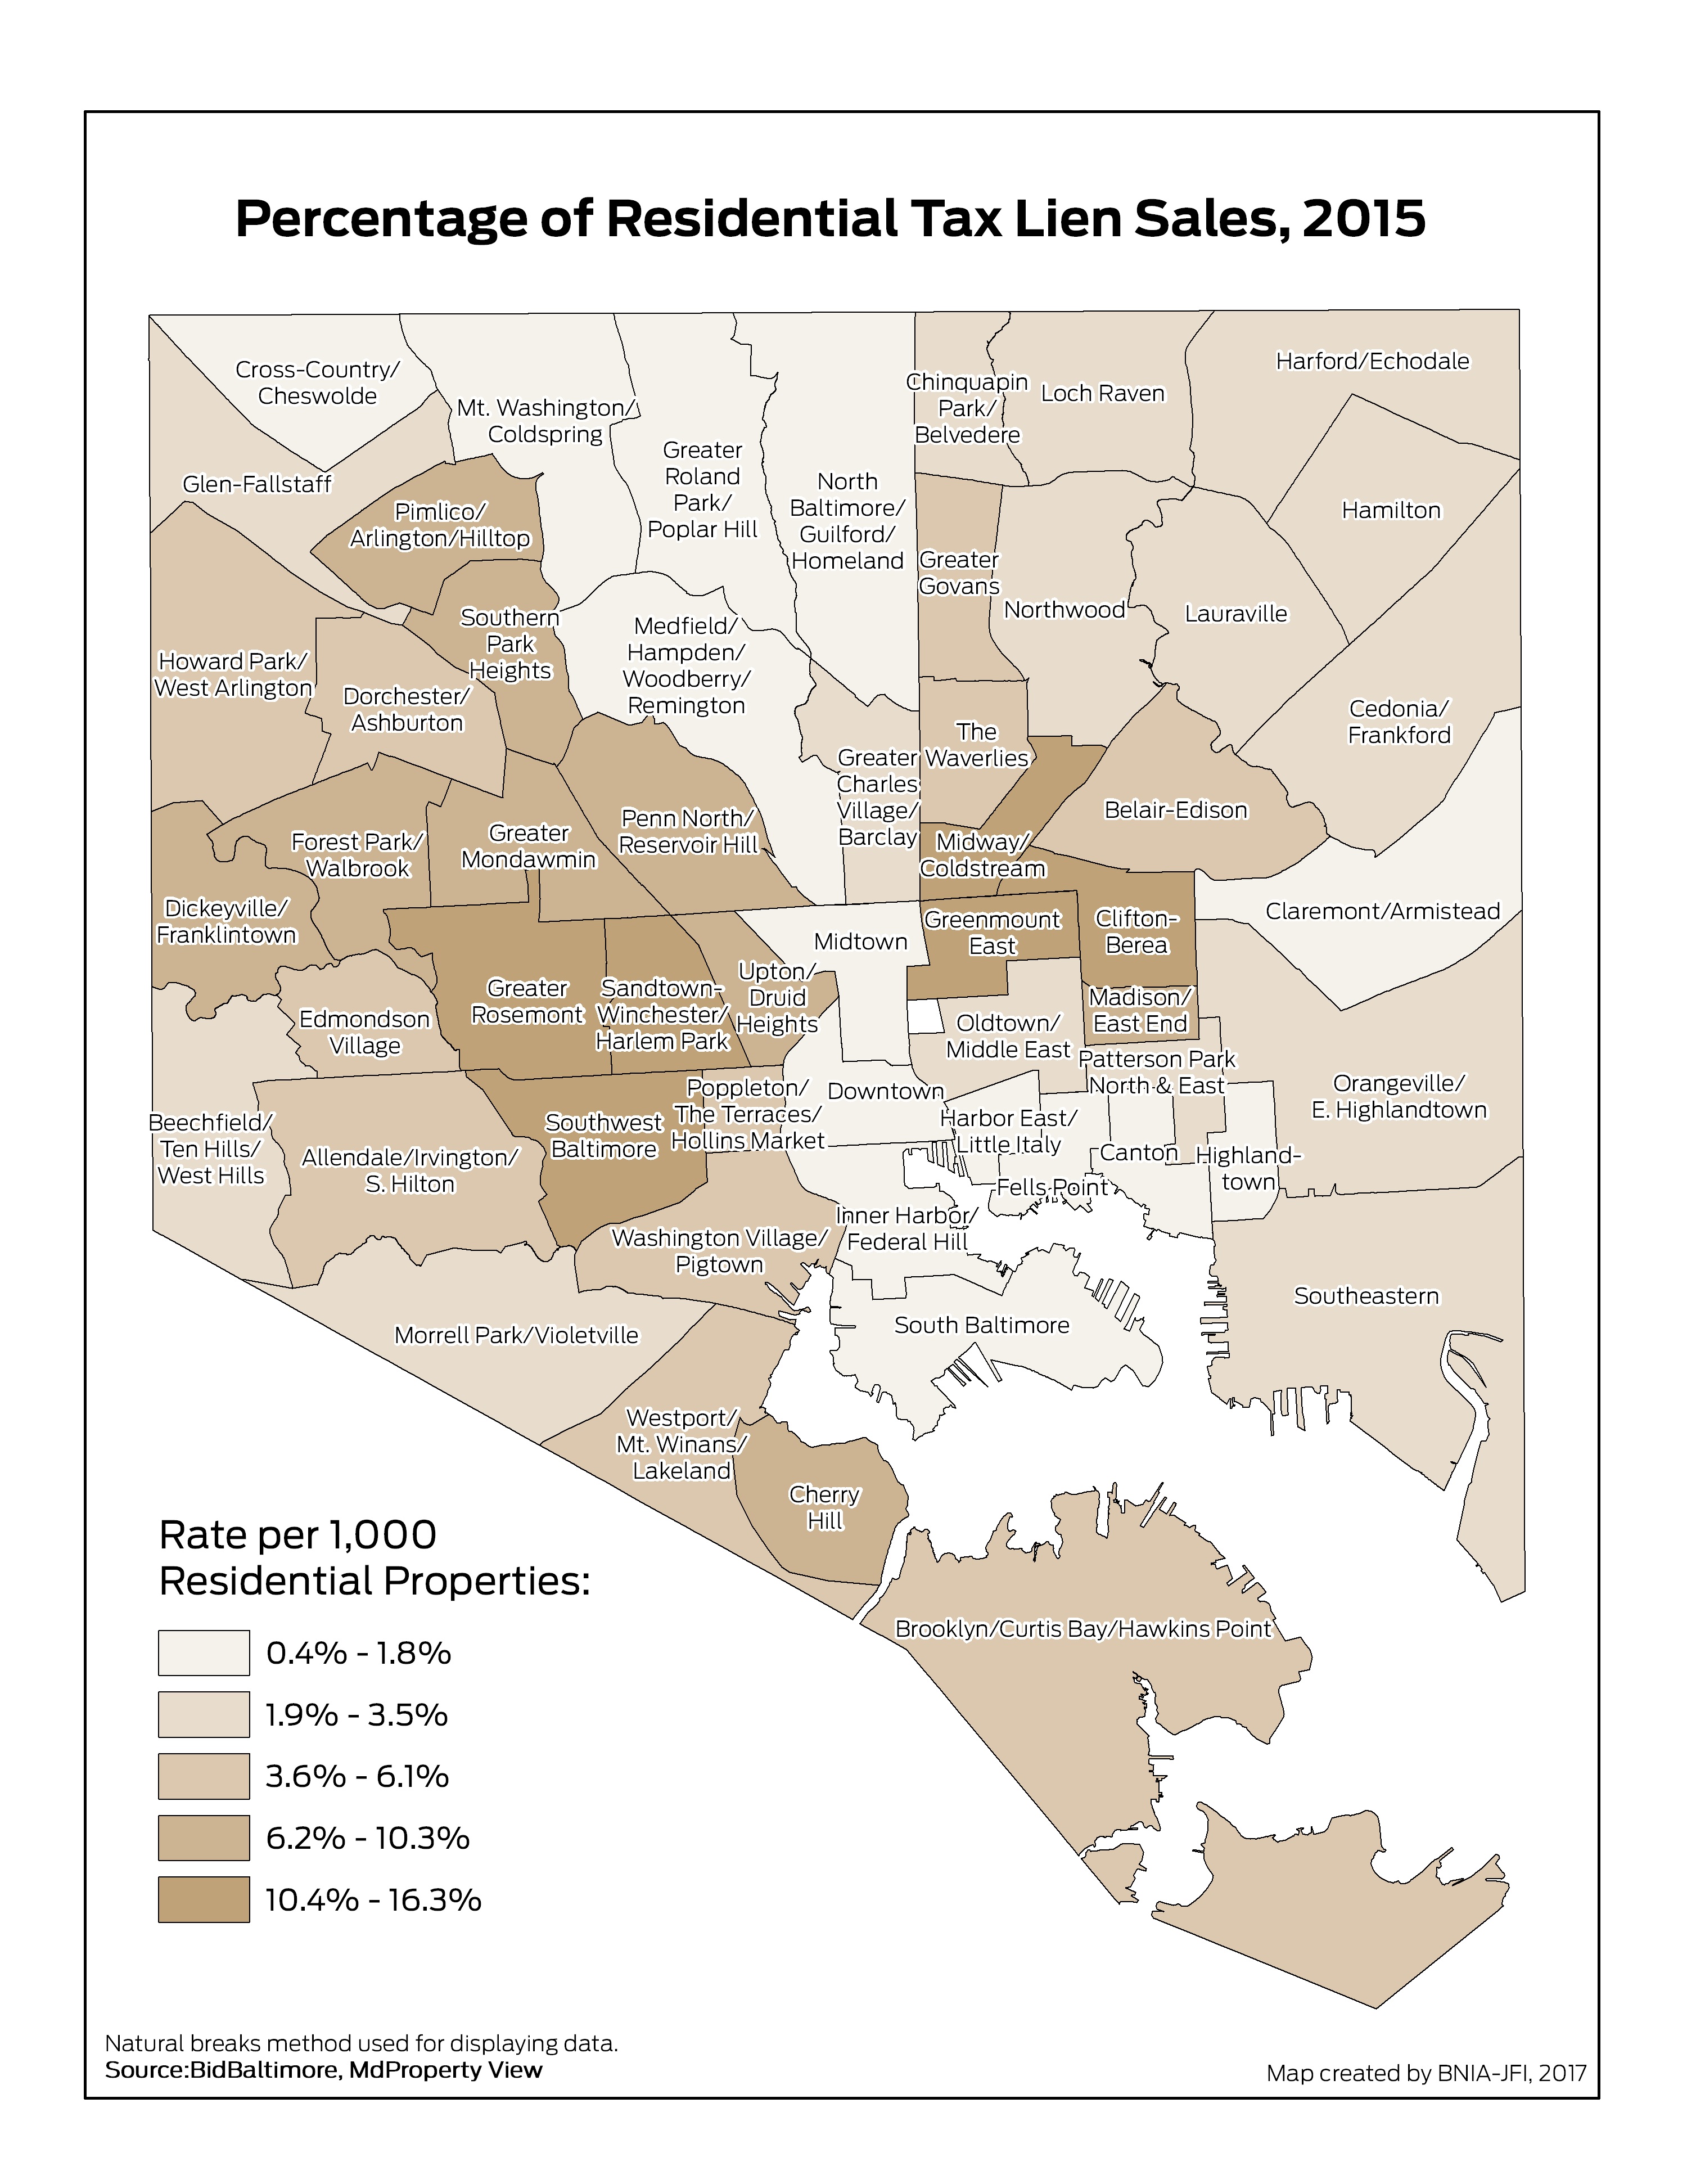
Percentage of Residential Tax Lien Sales
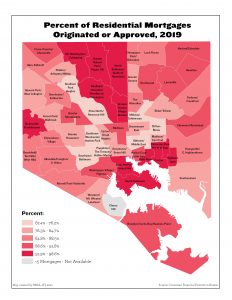
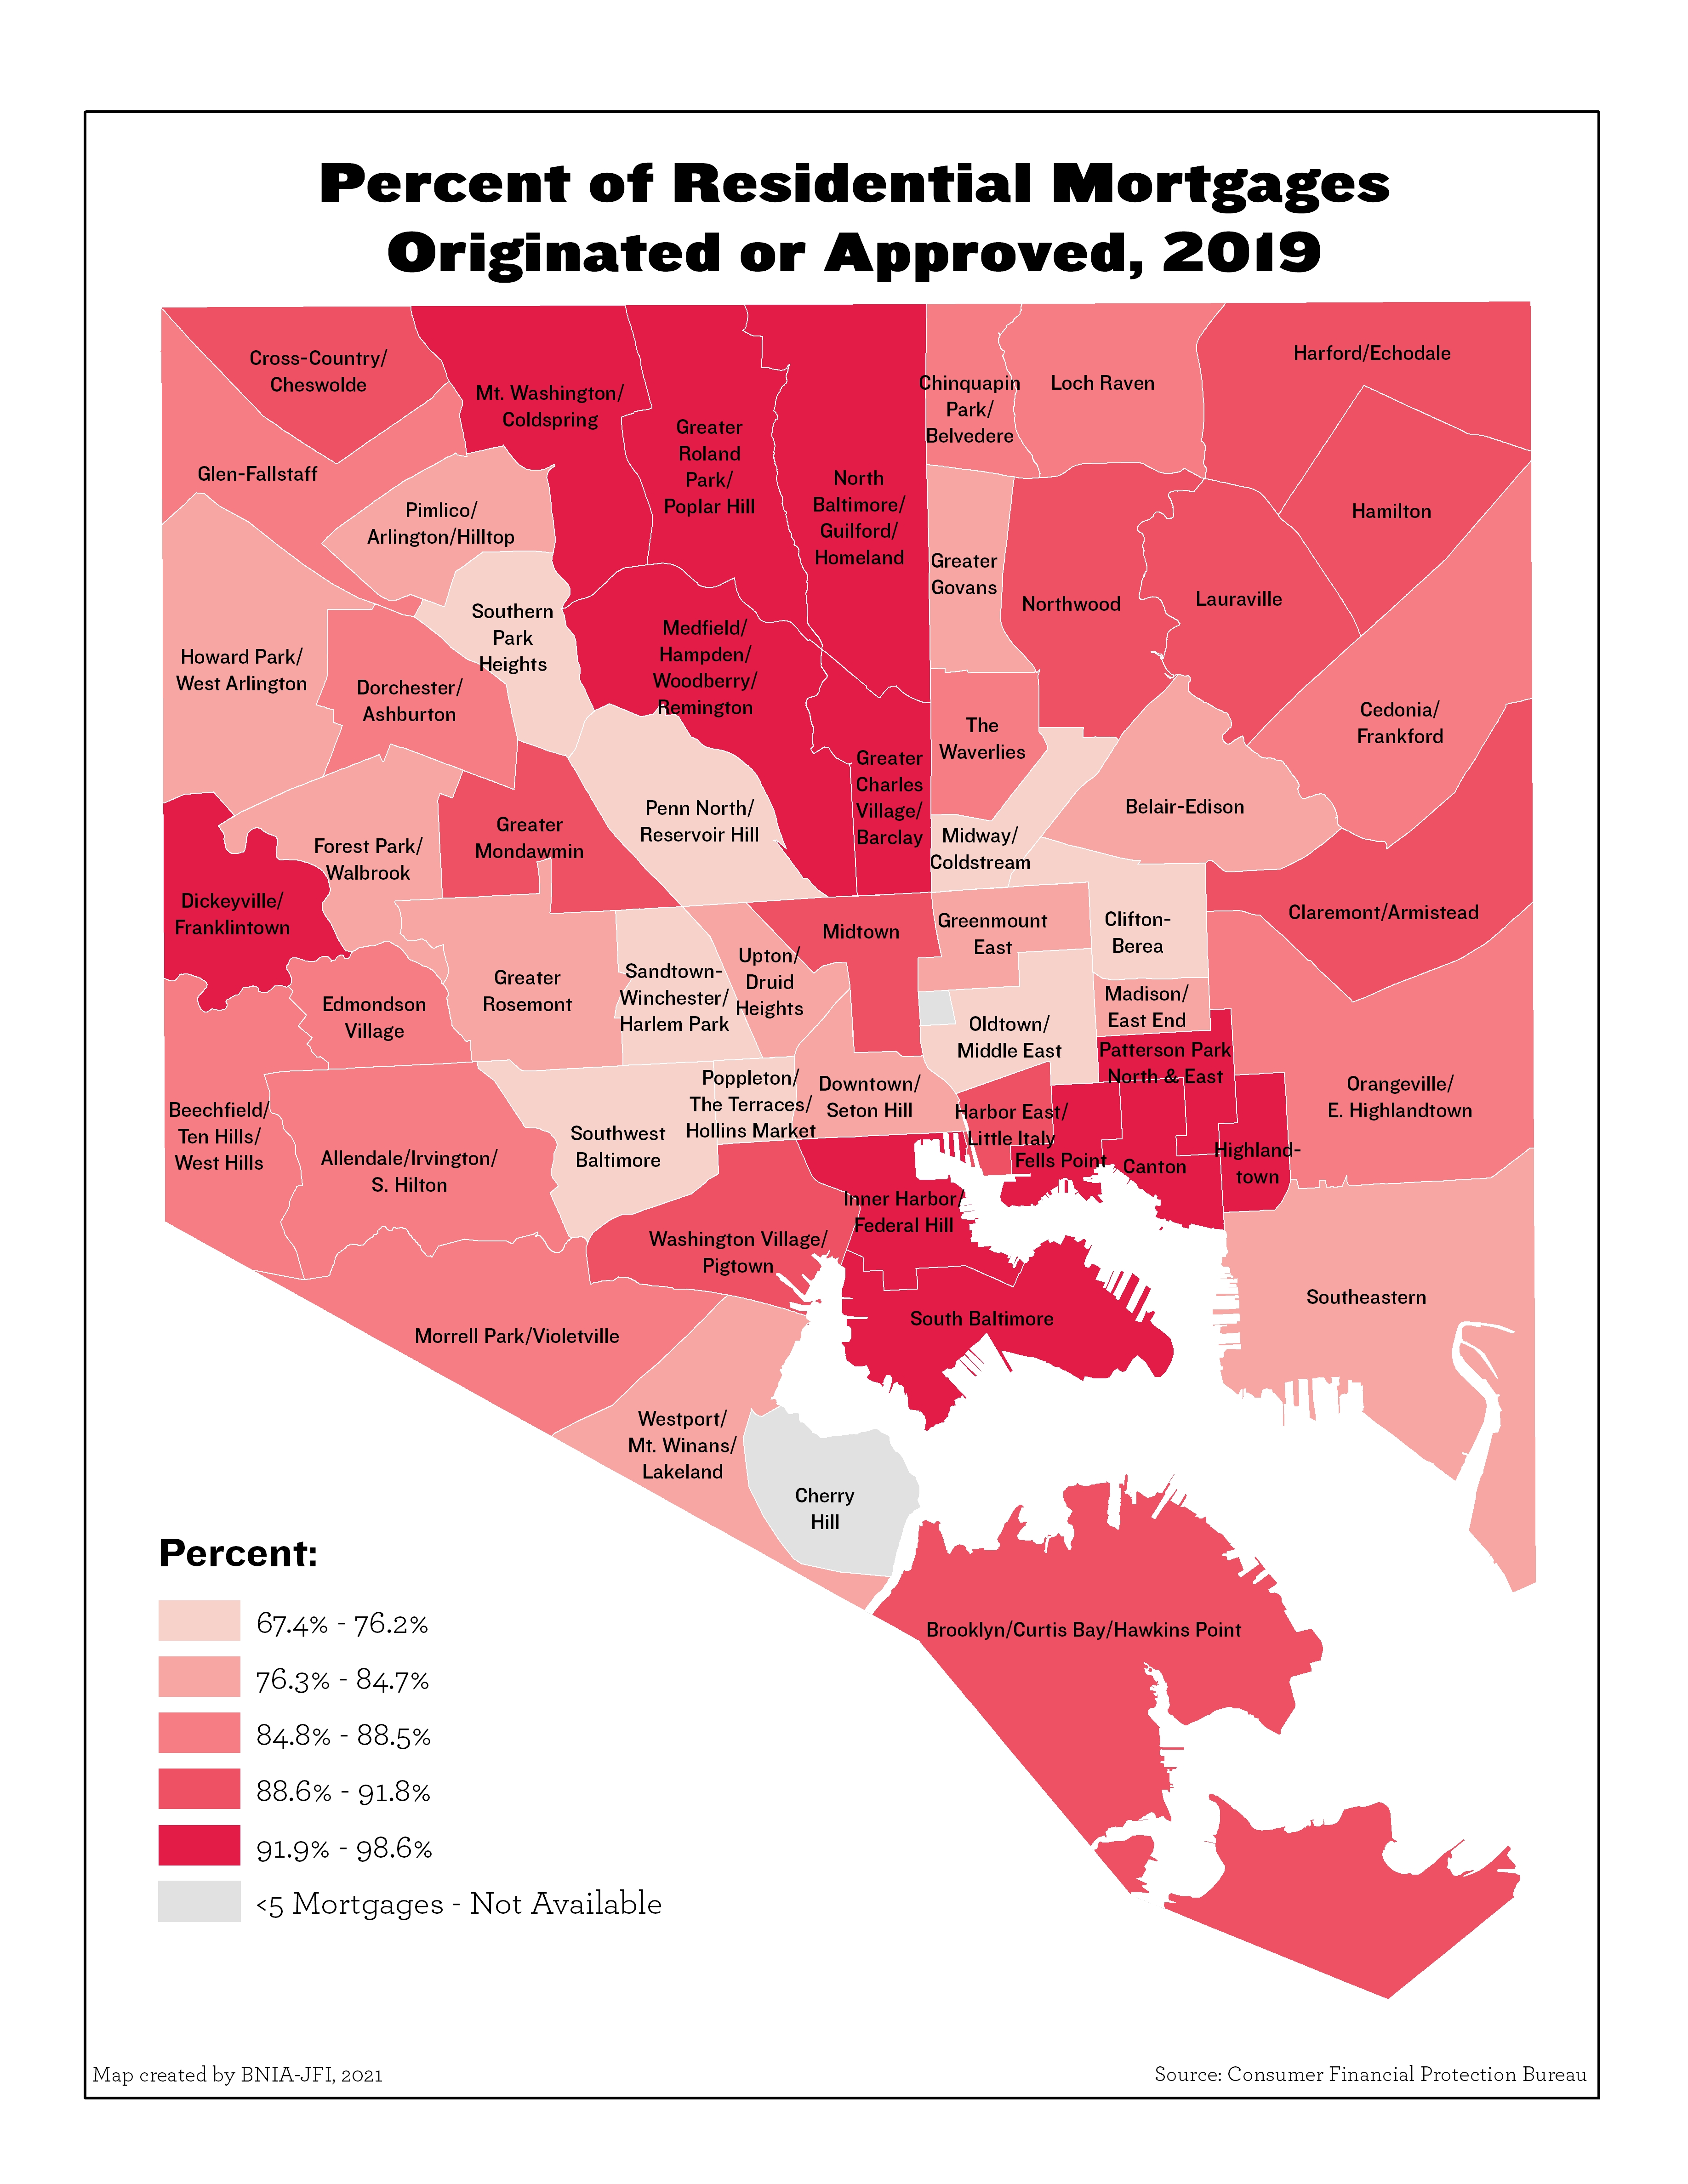
Percent of Residential Mortgages Originated or Approved
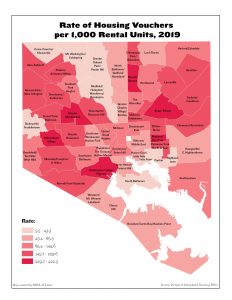
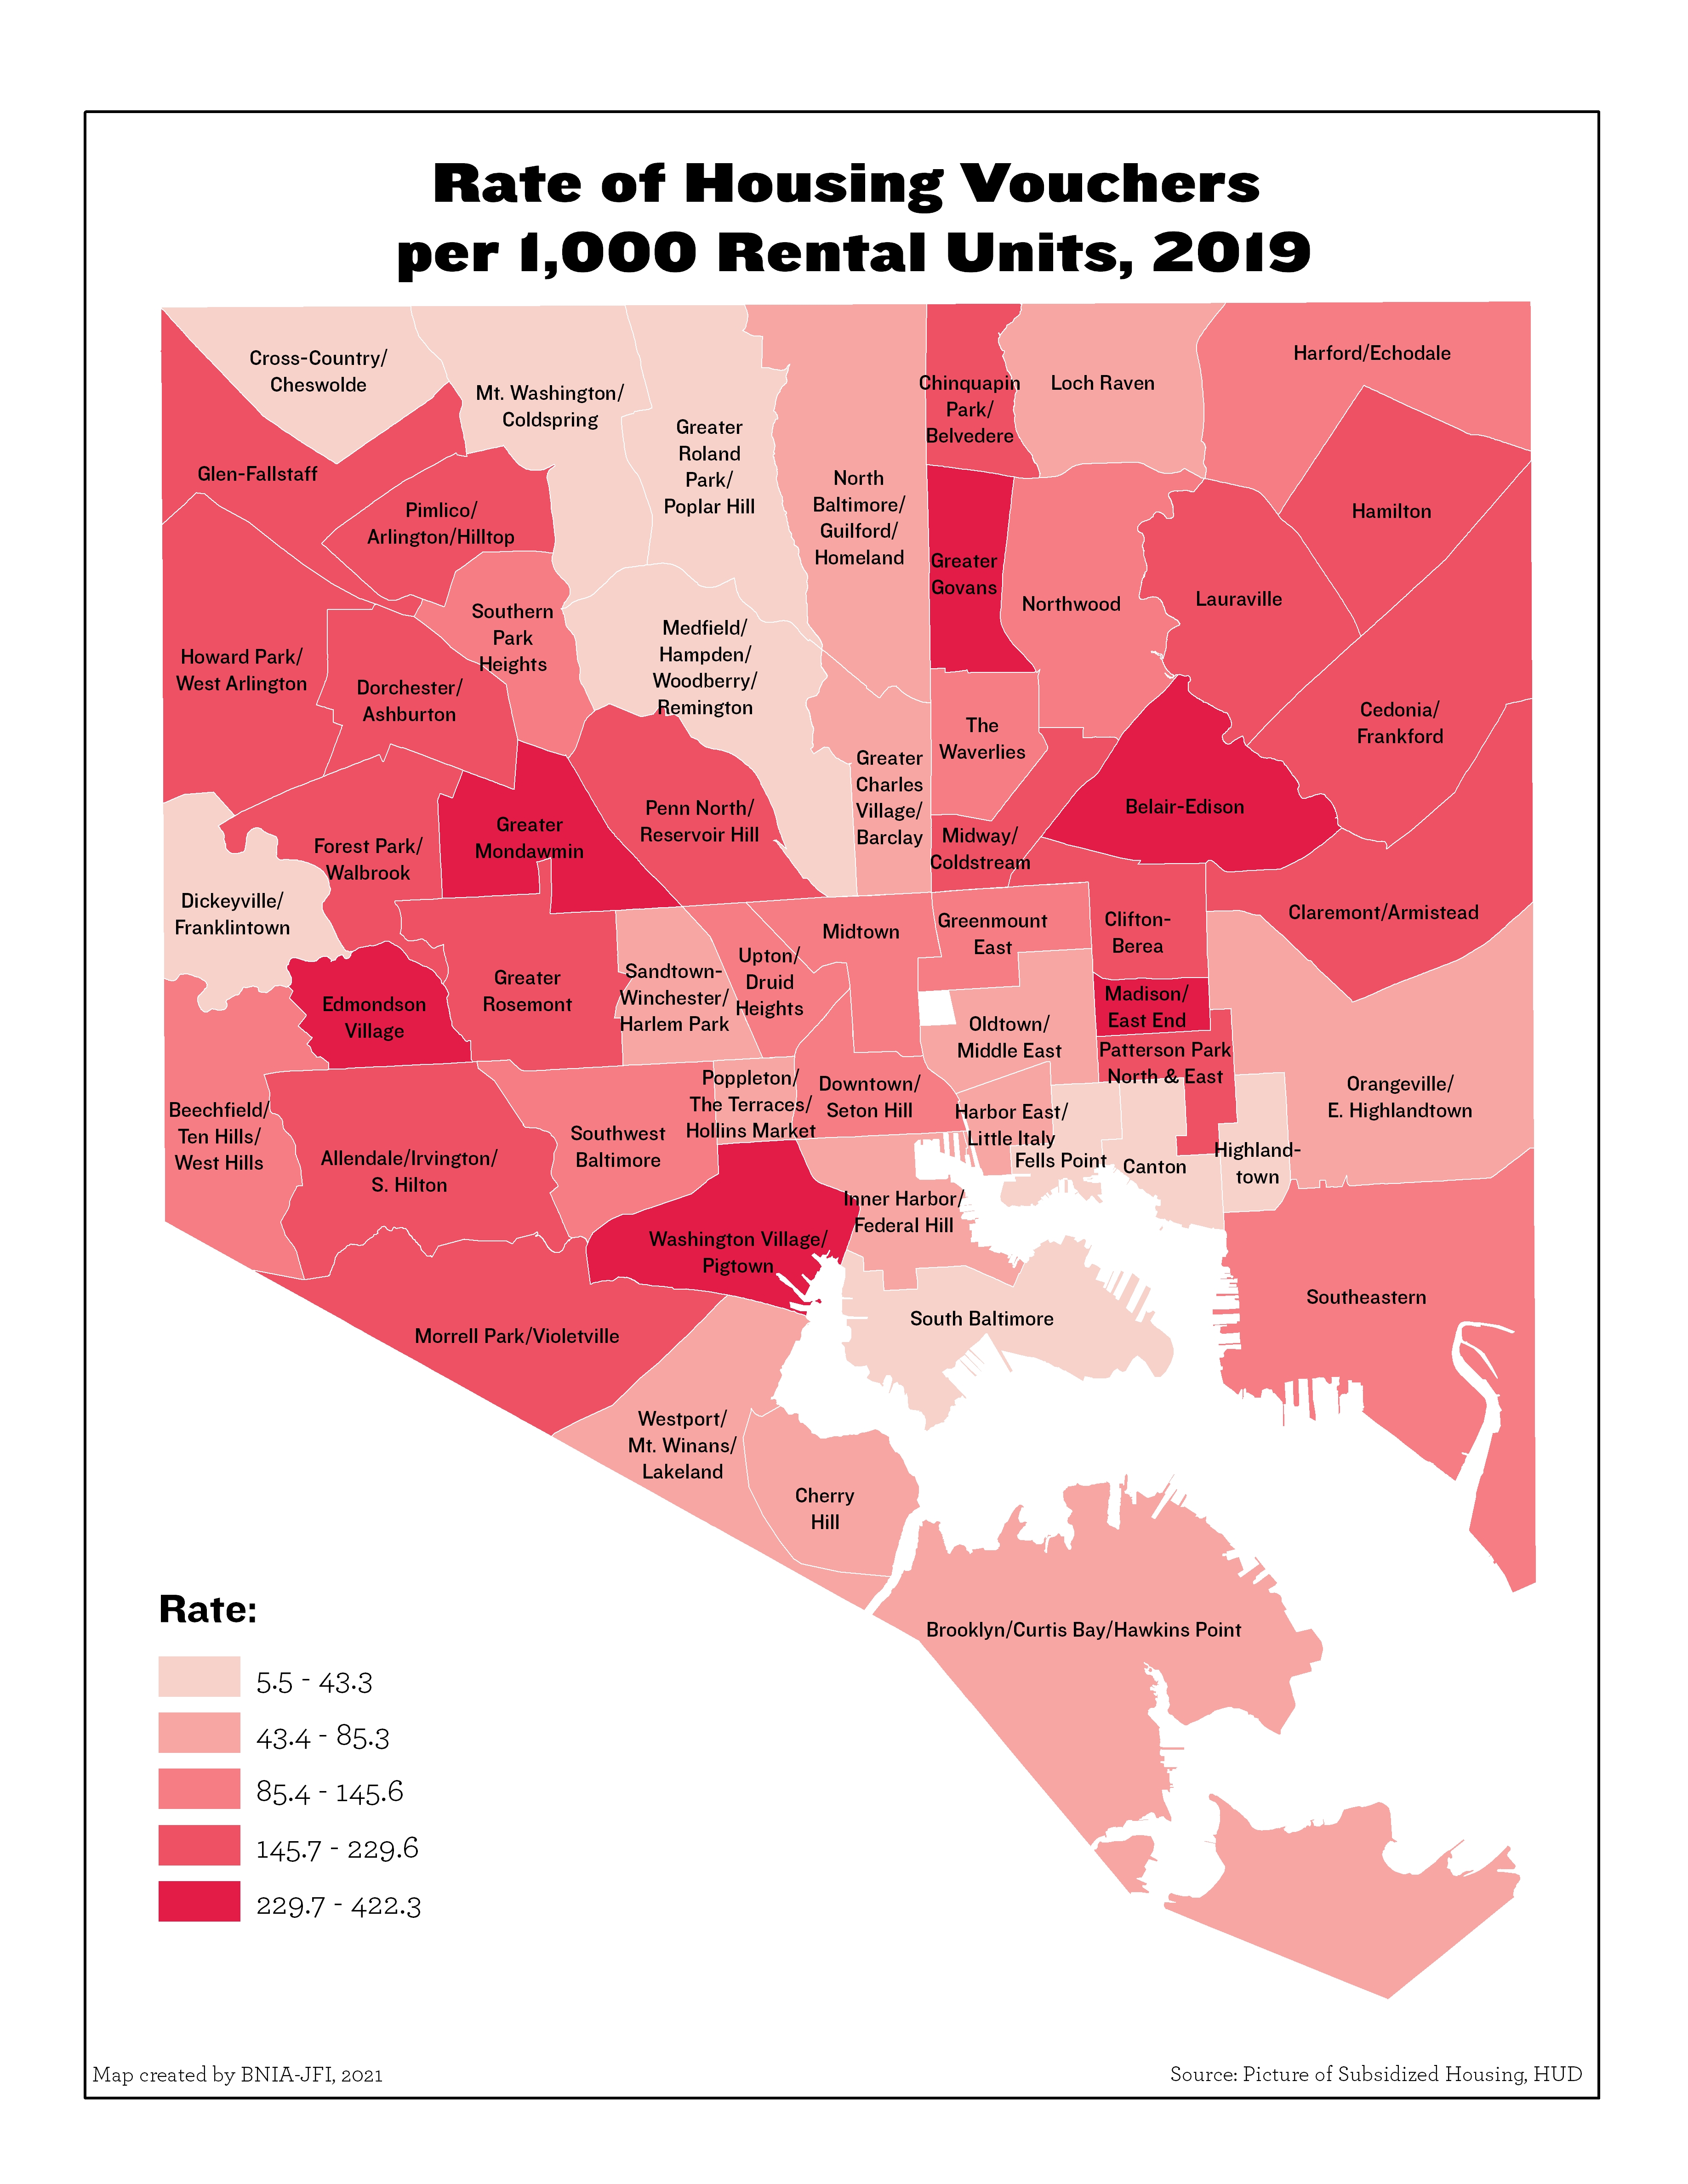
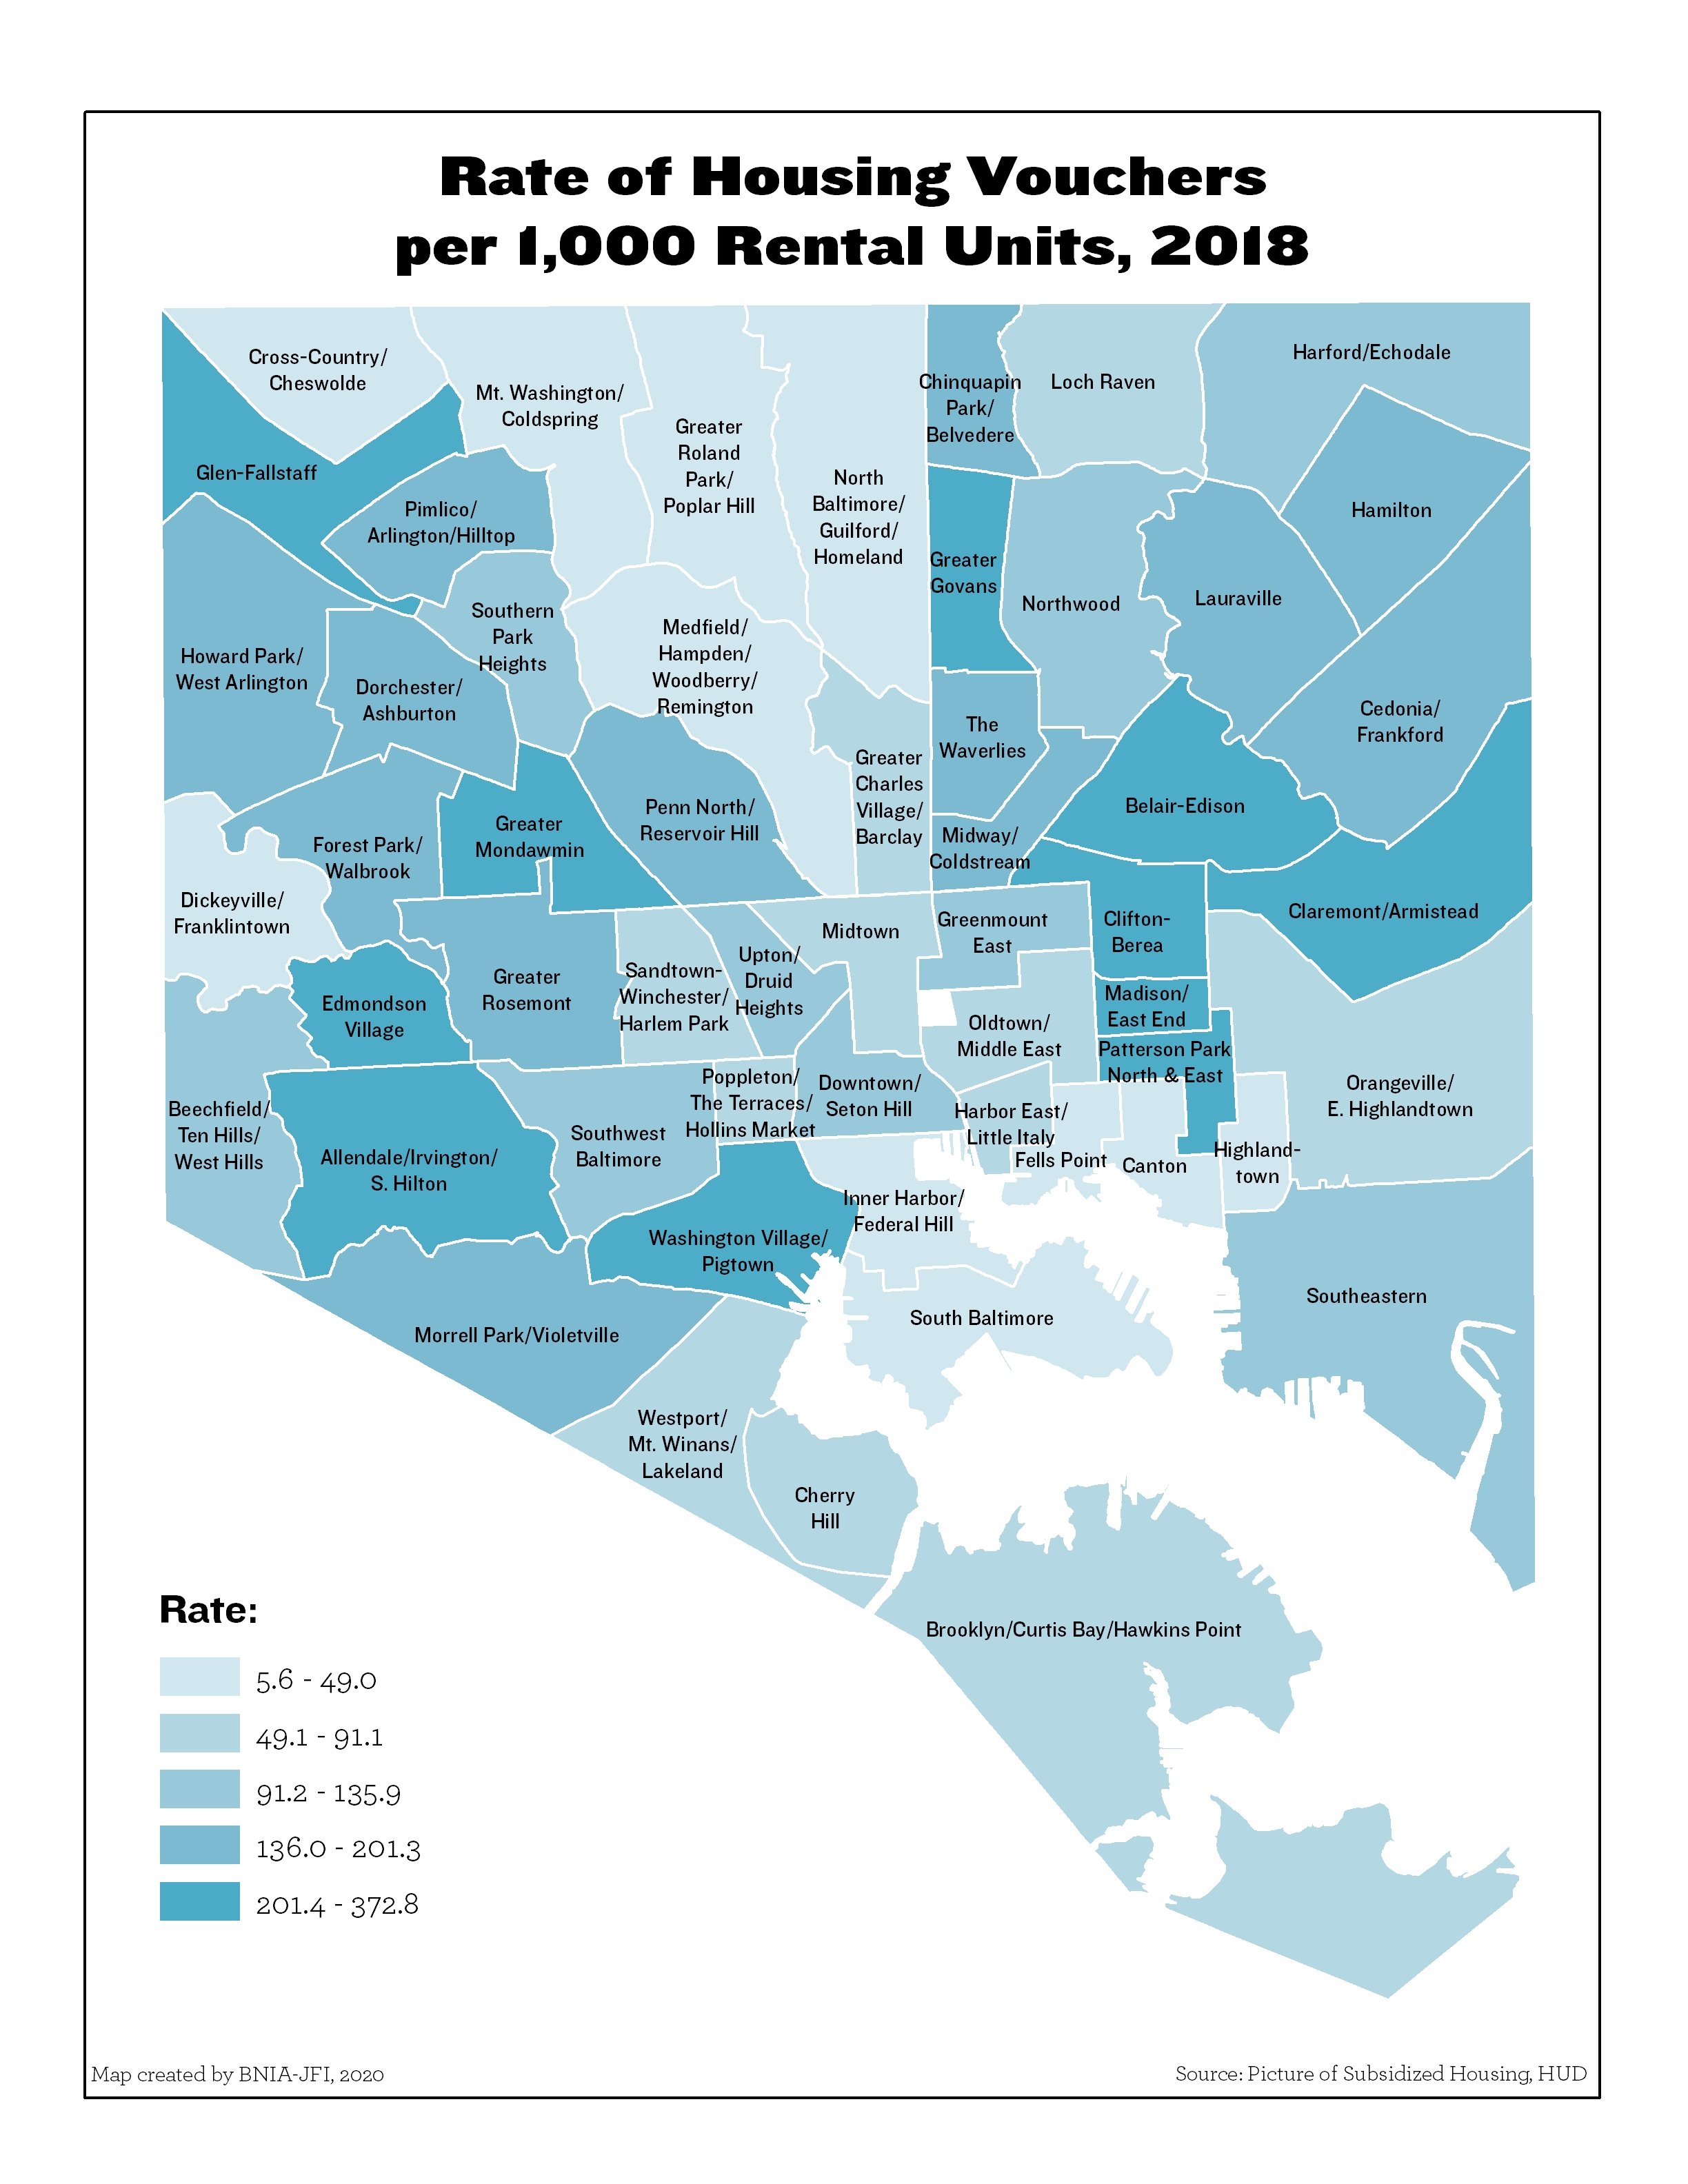
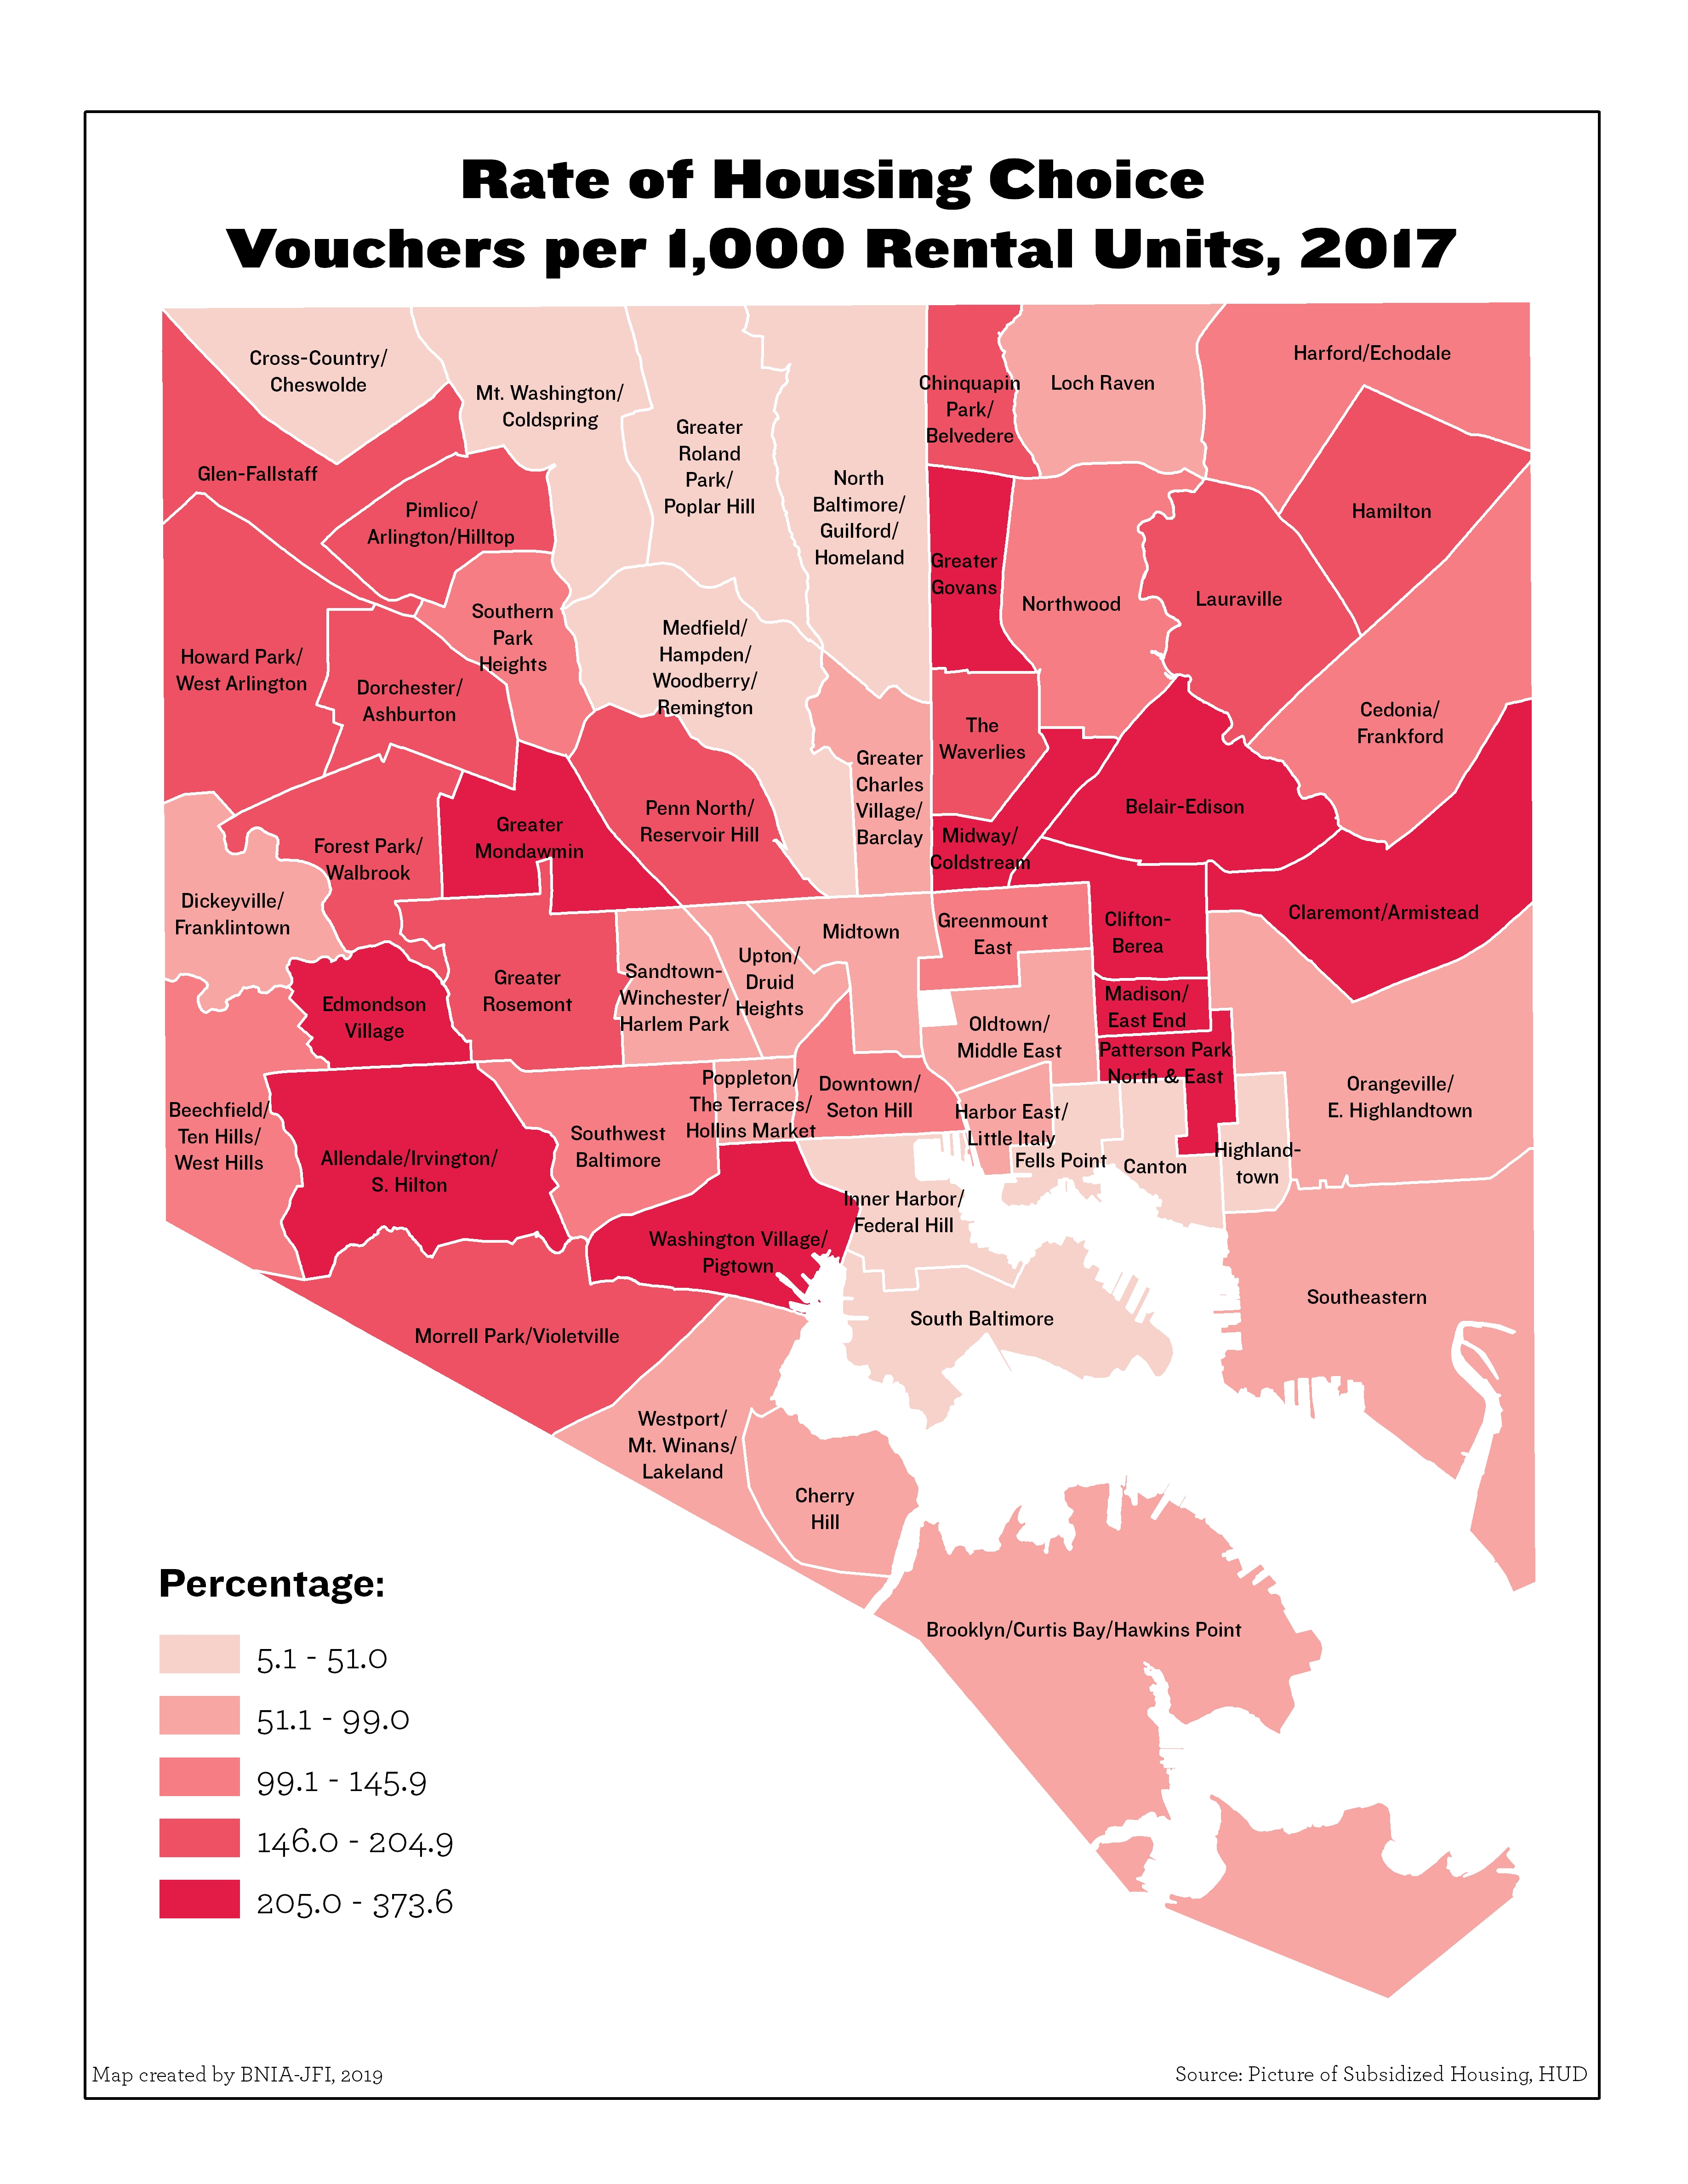
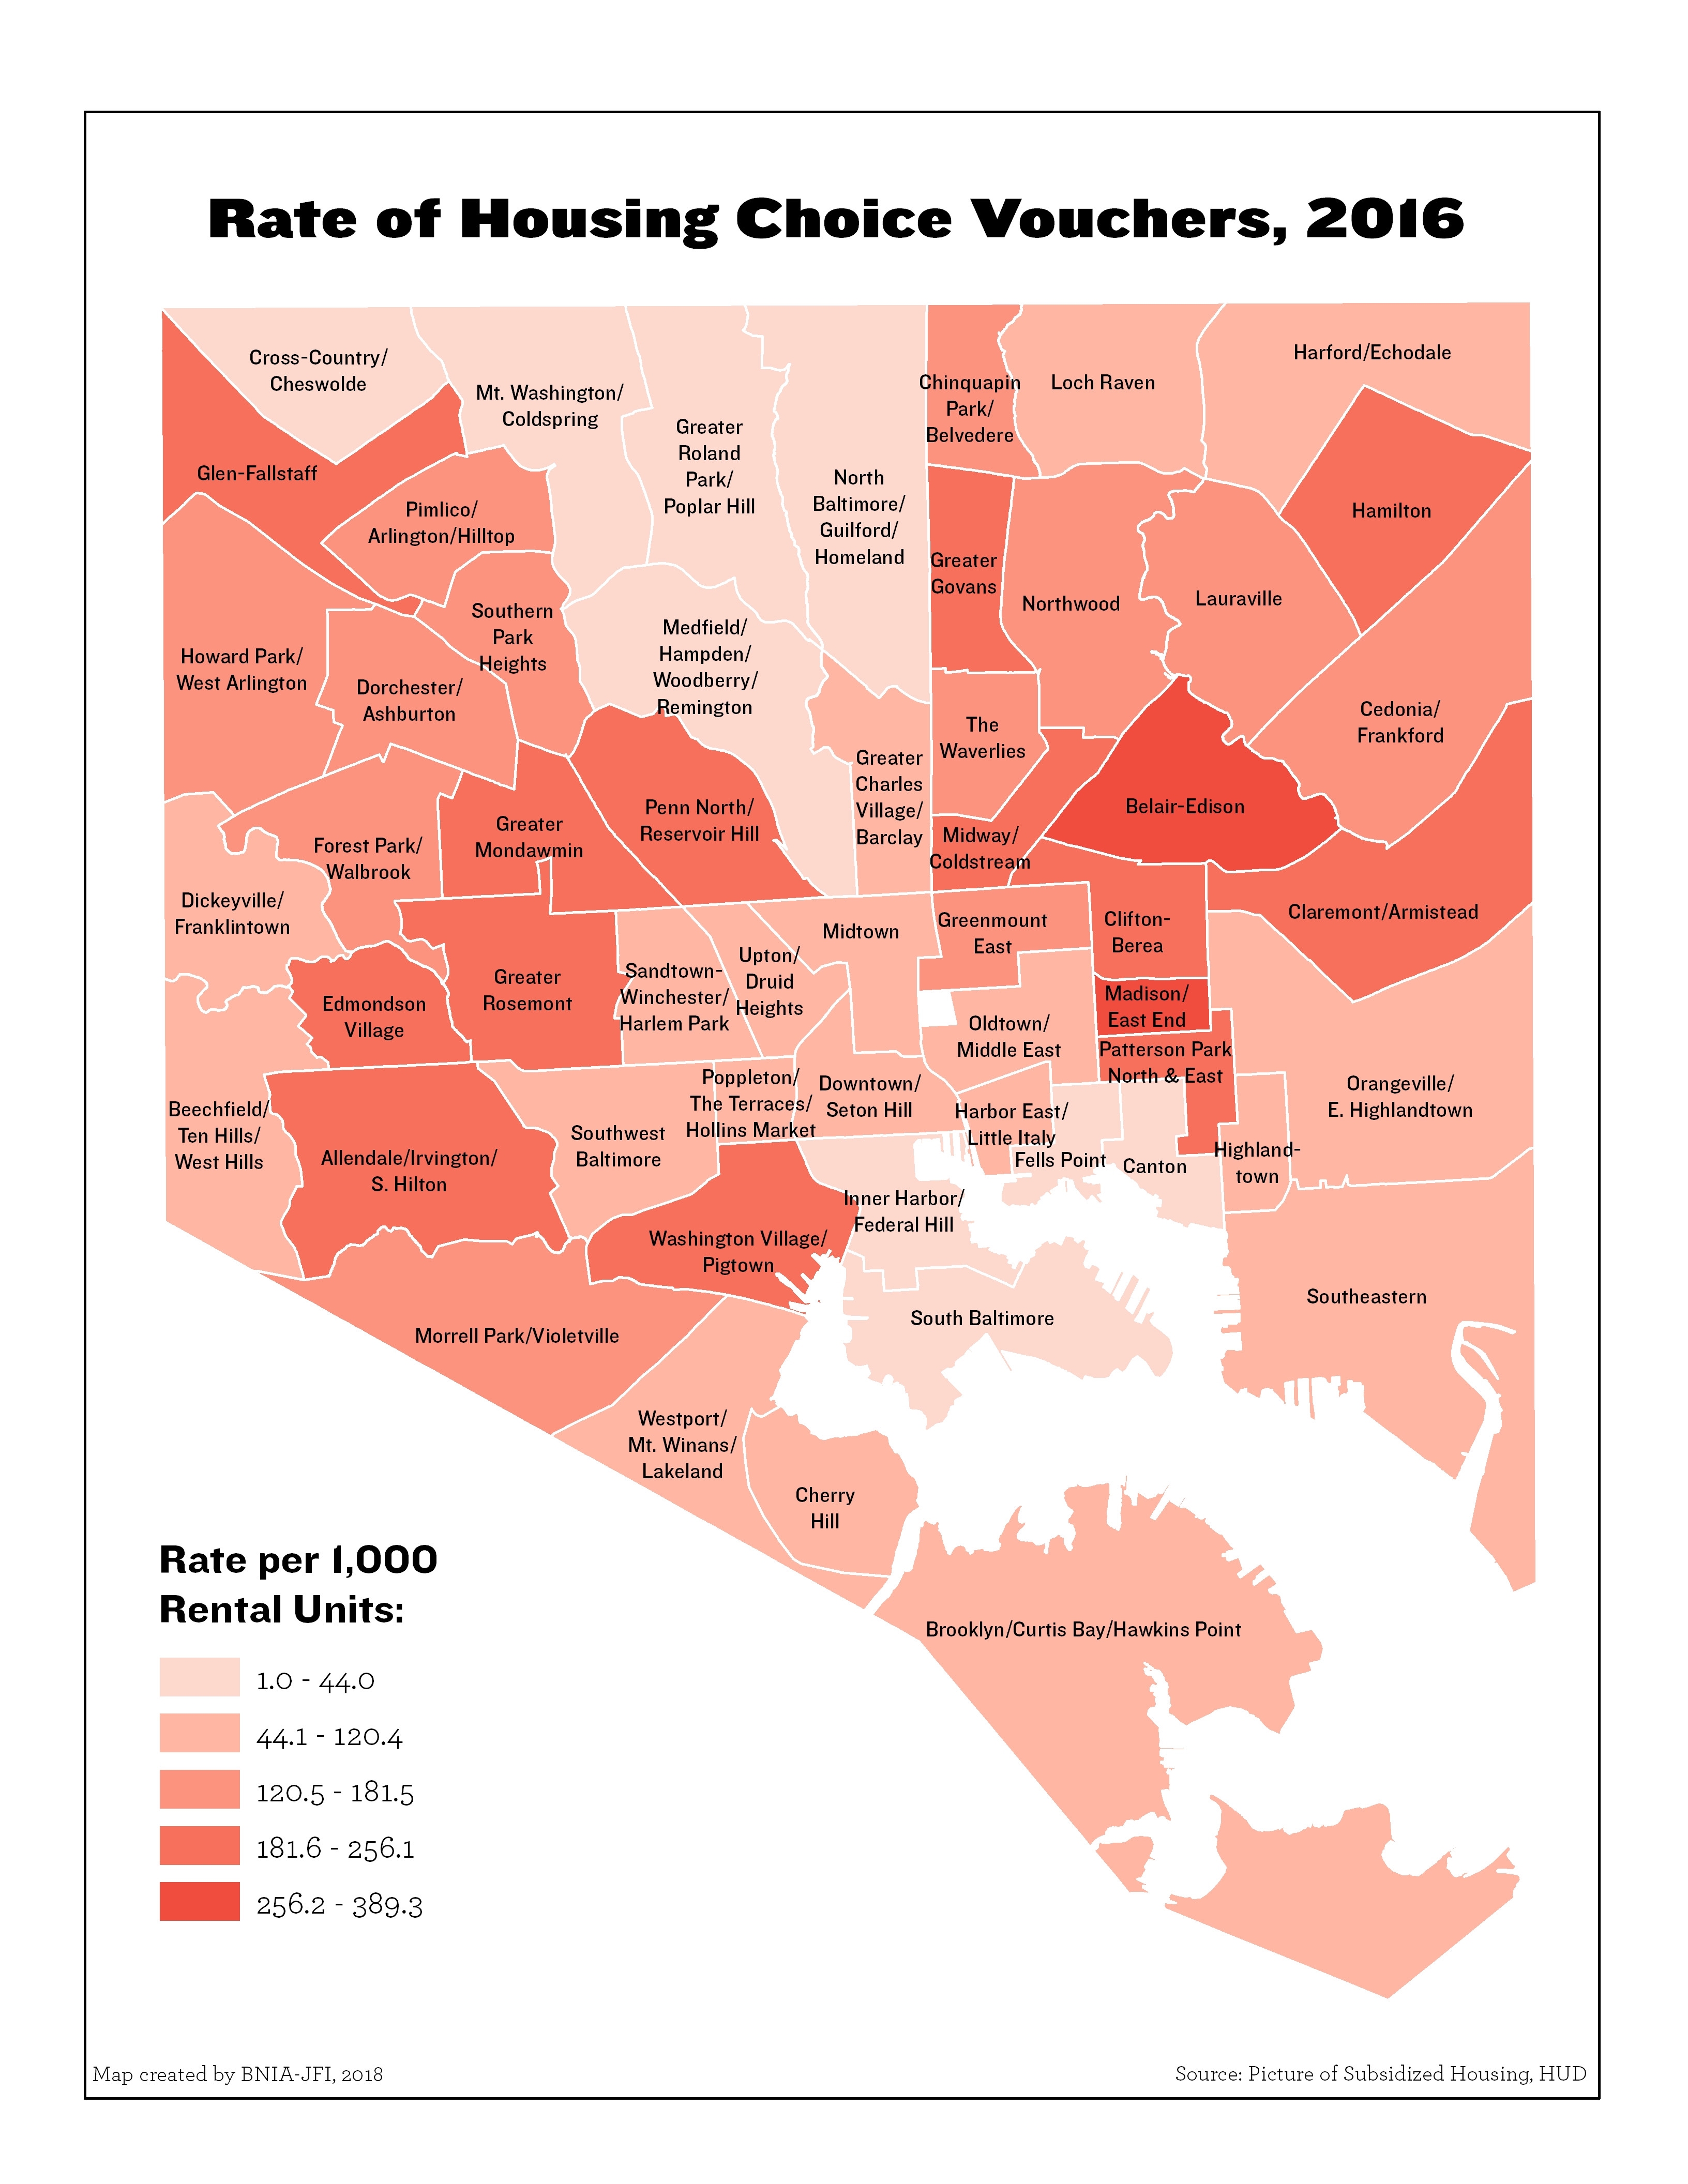
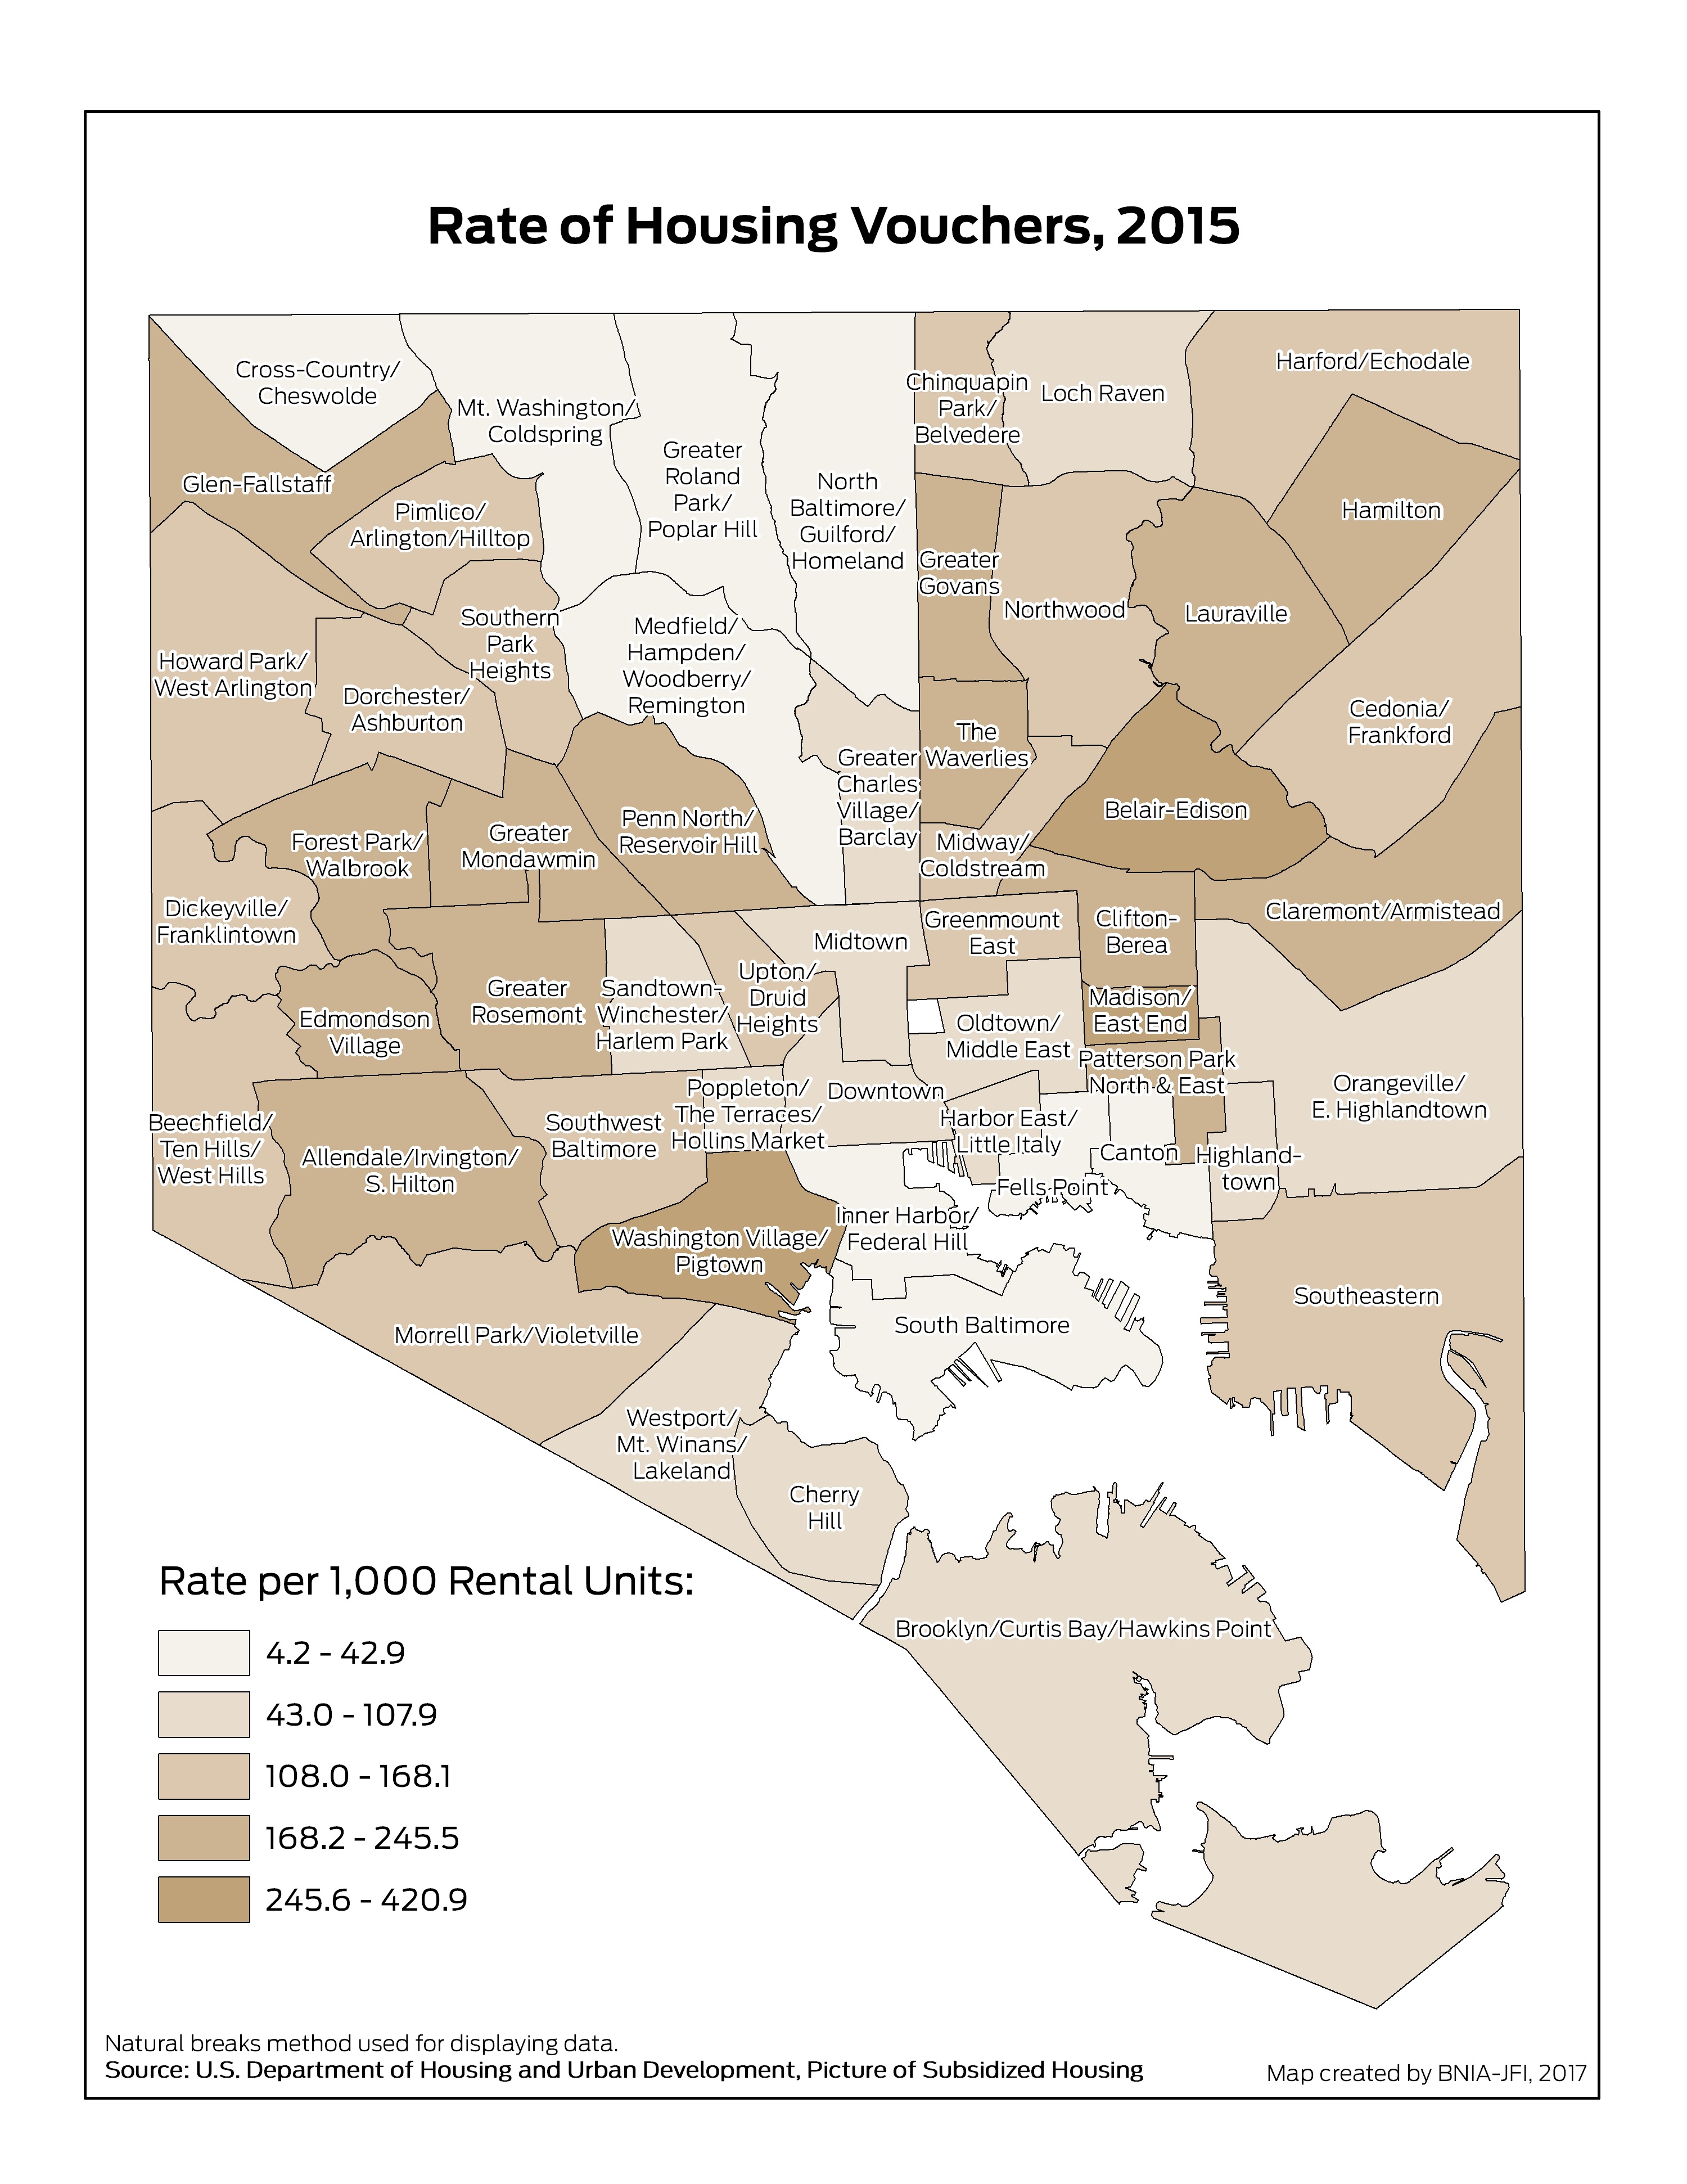
Rate of Housing Vouchers per 1,000 Rental Units

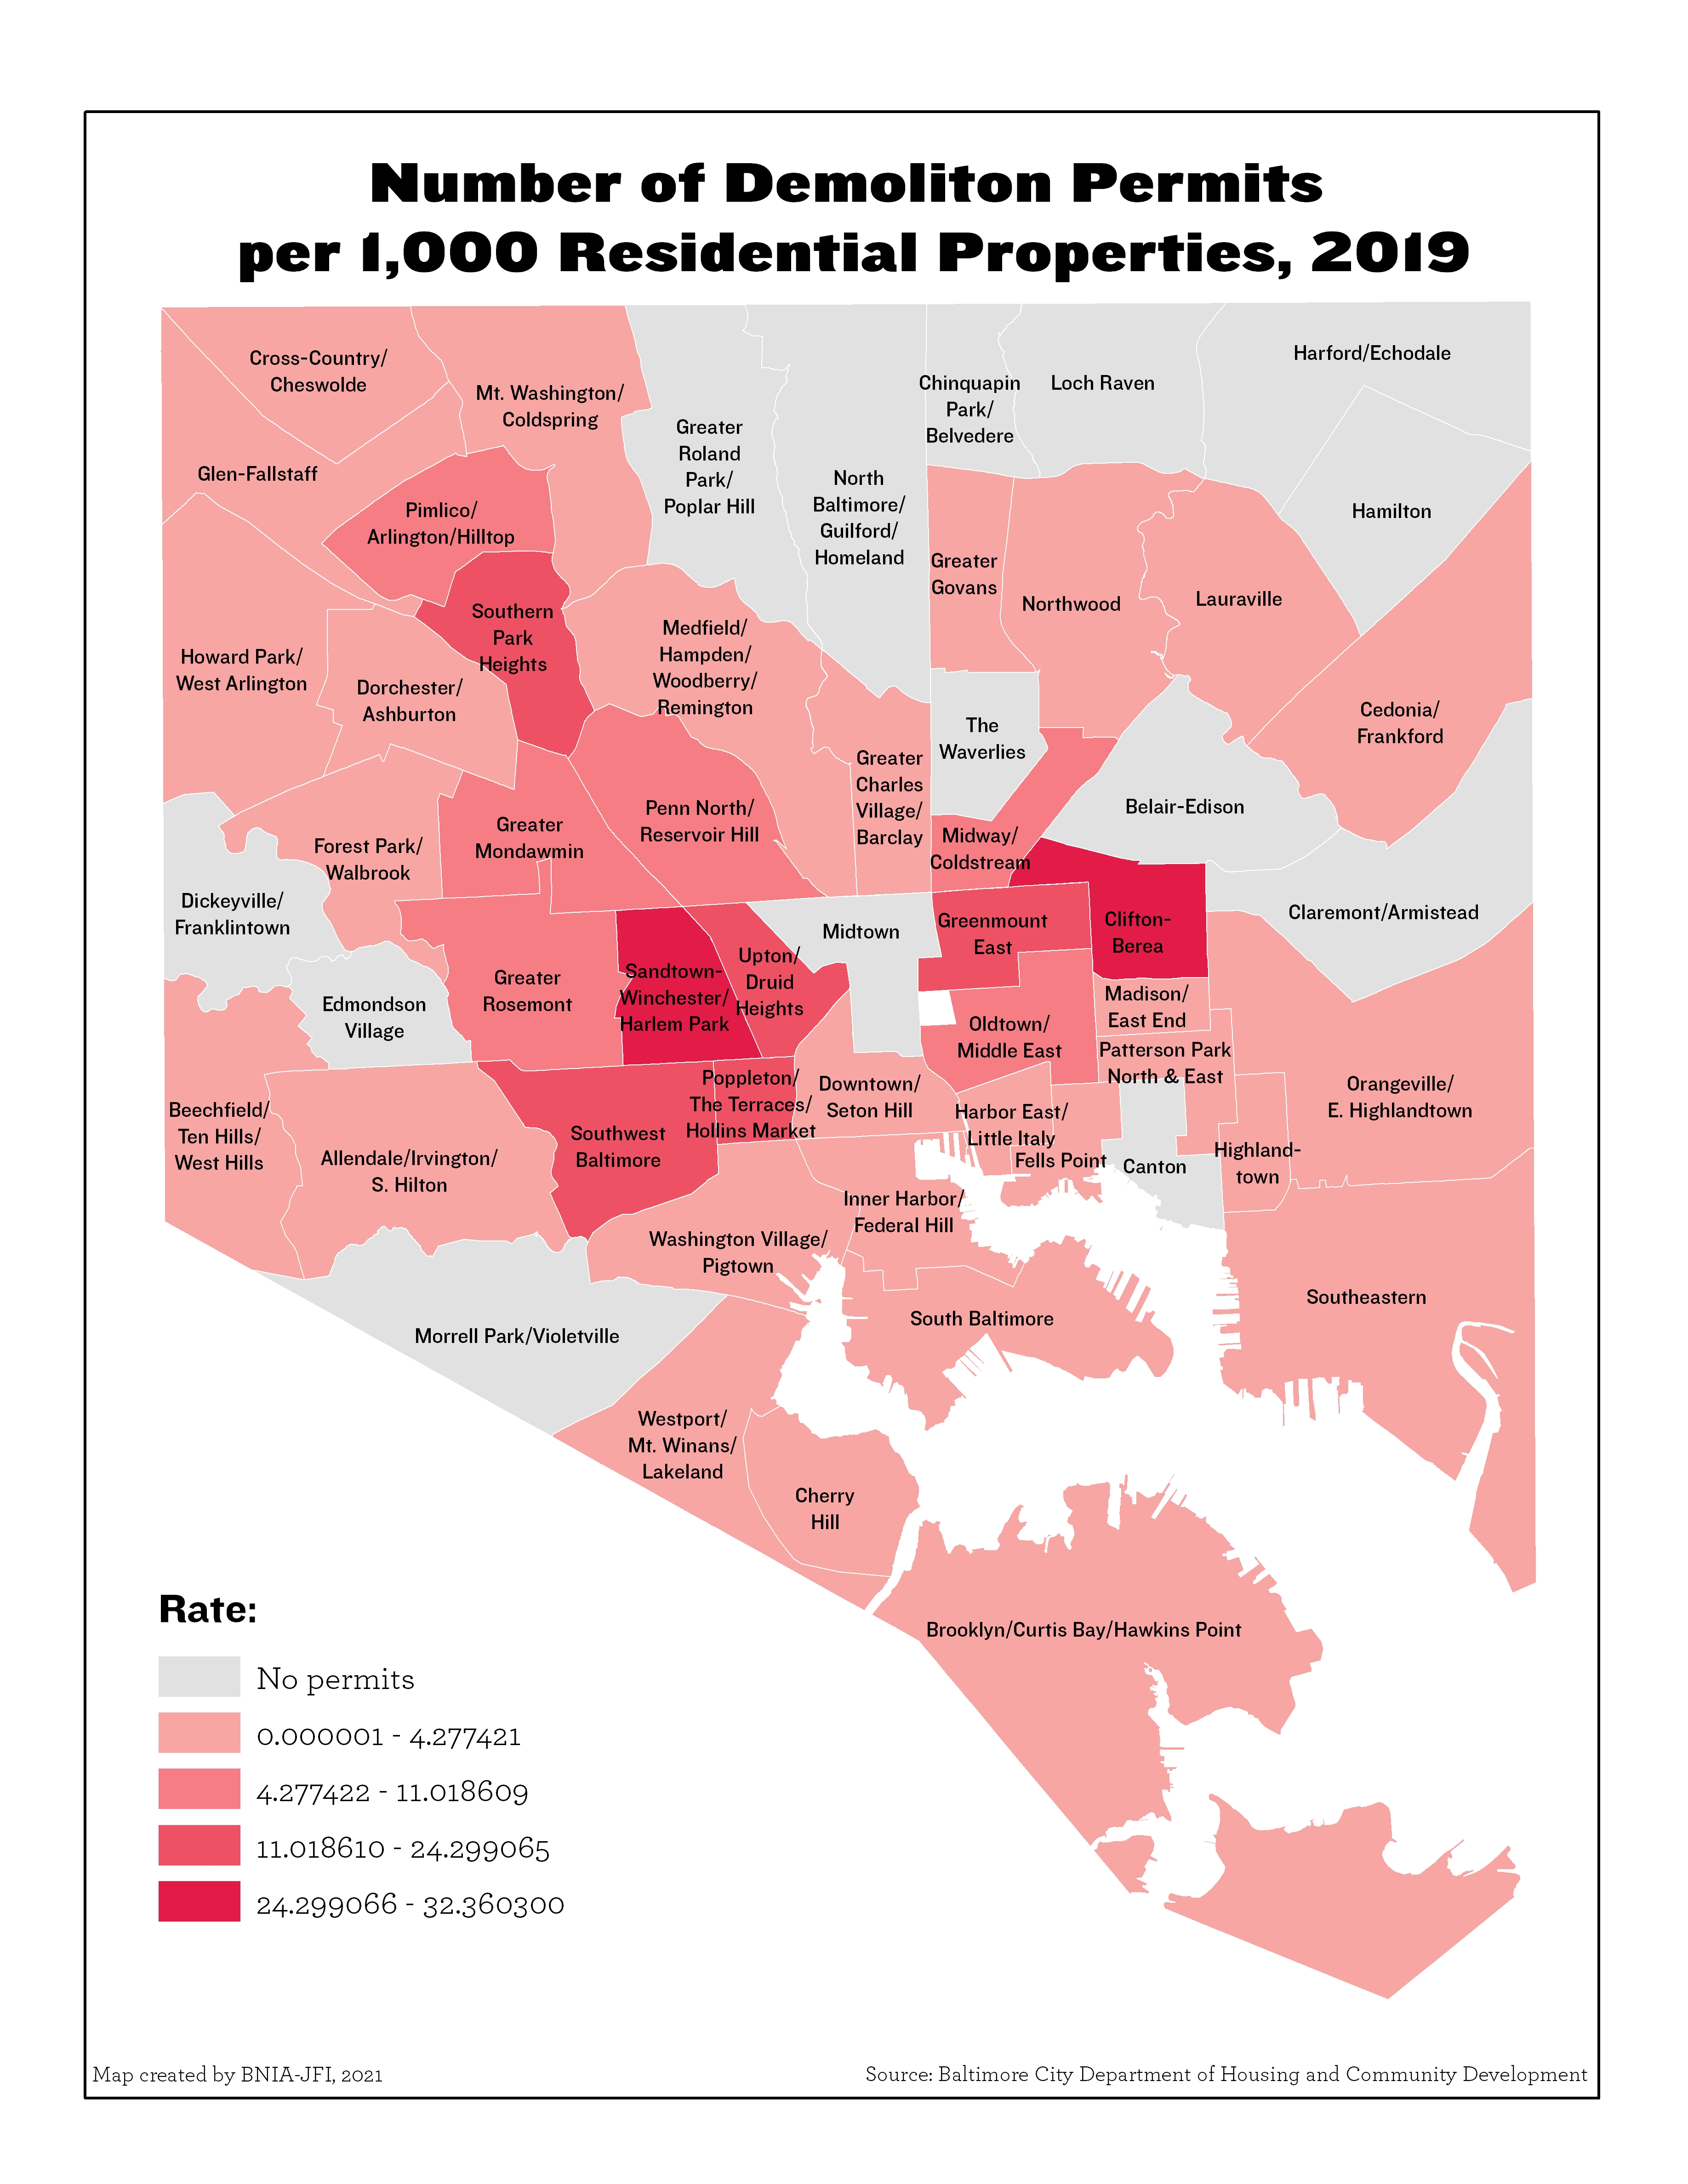
Number of Demolition Permits per 1,000 Residential Properties (2019)
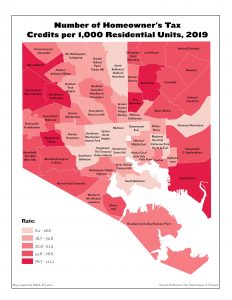
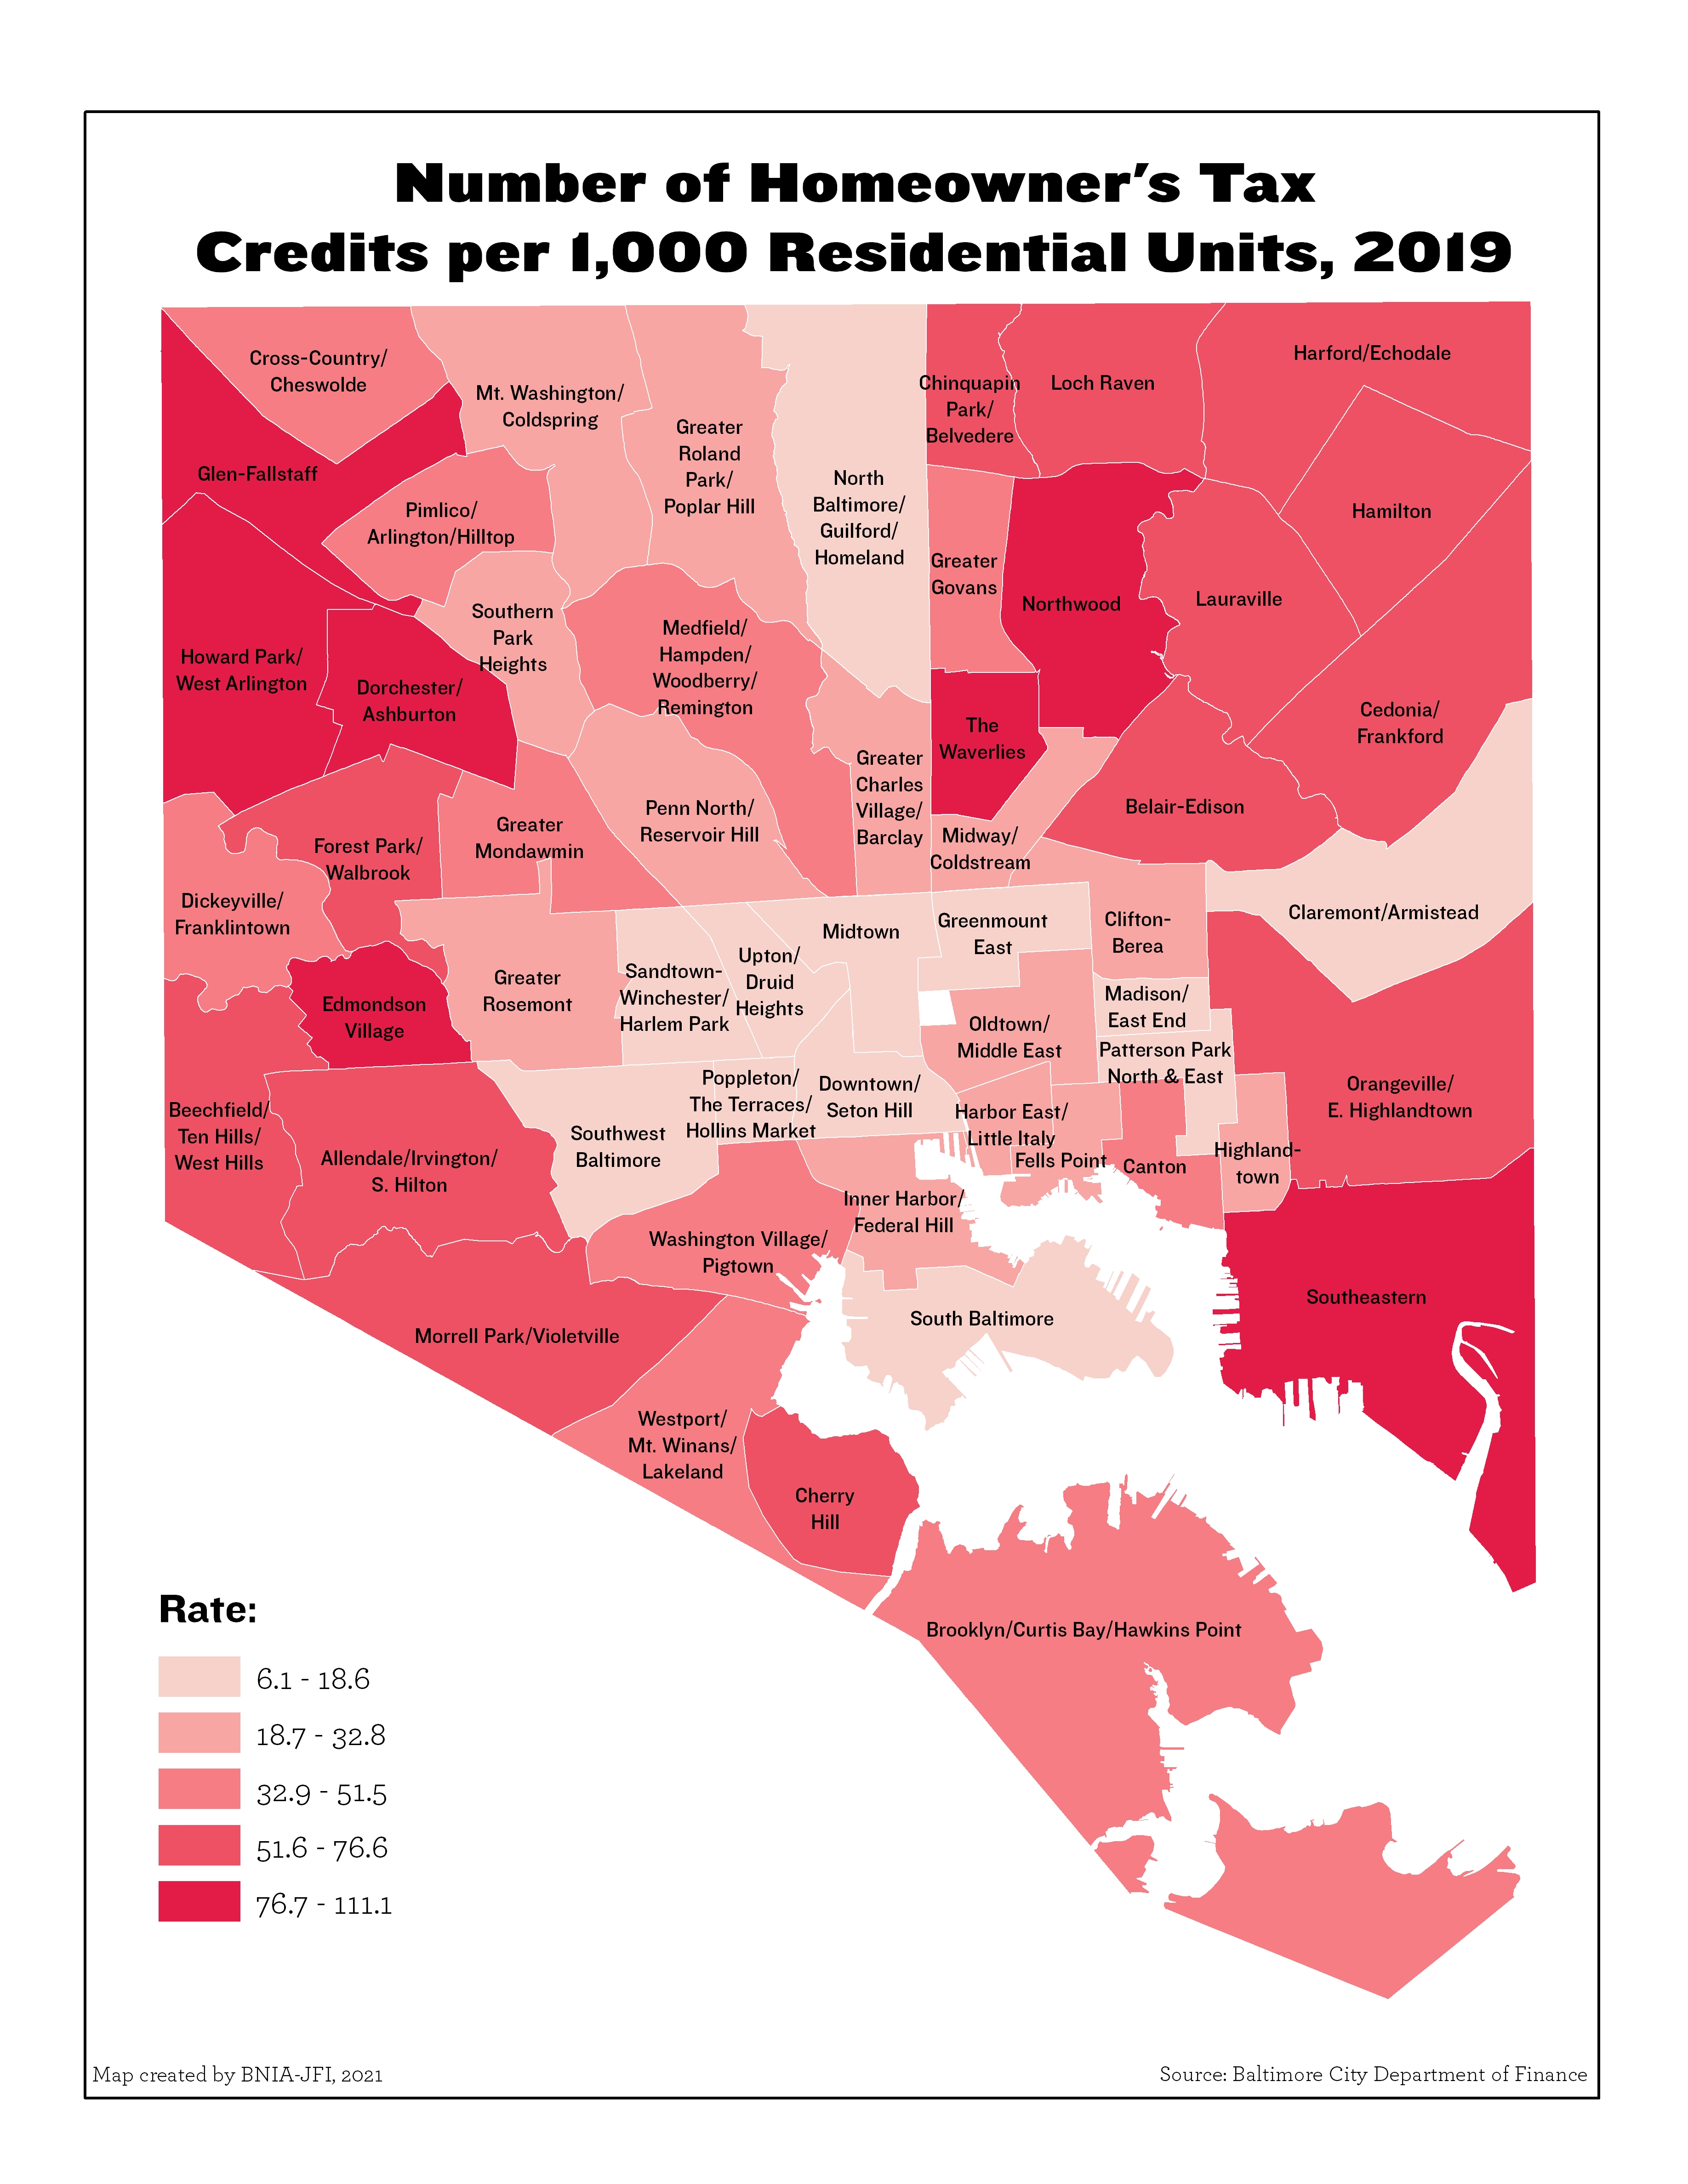
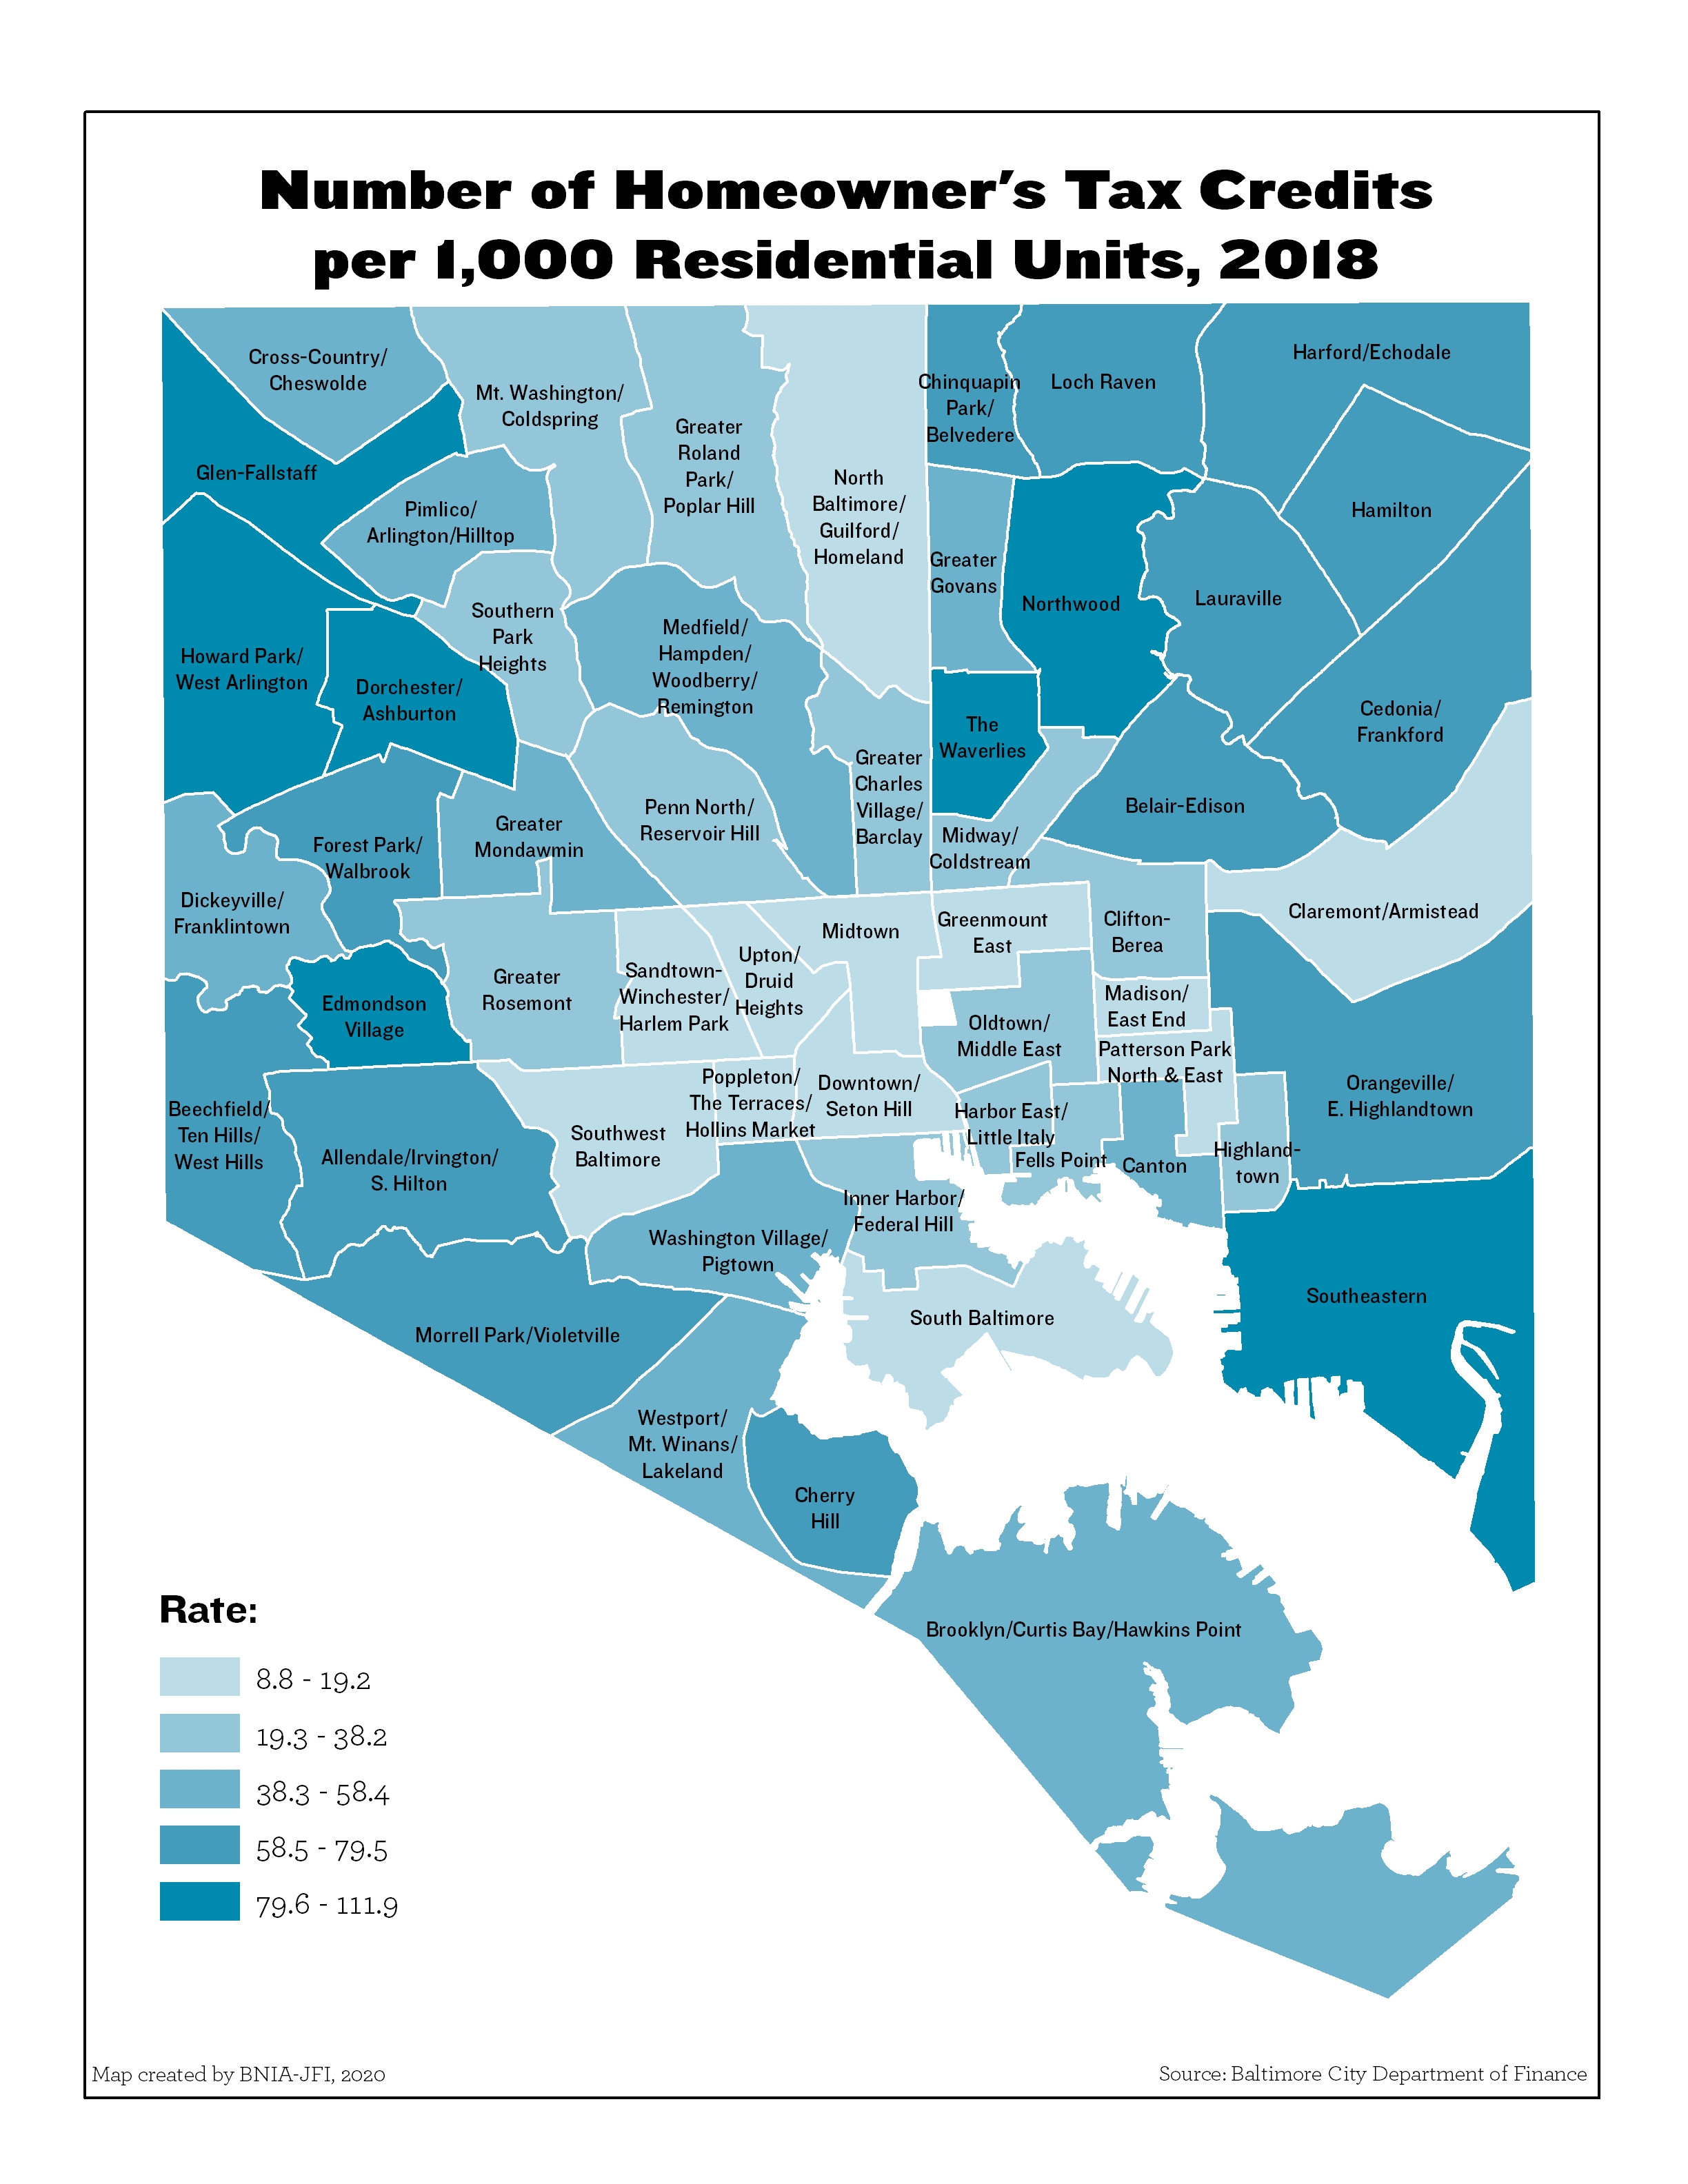
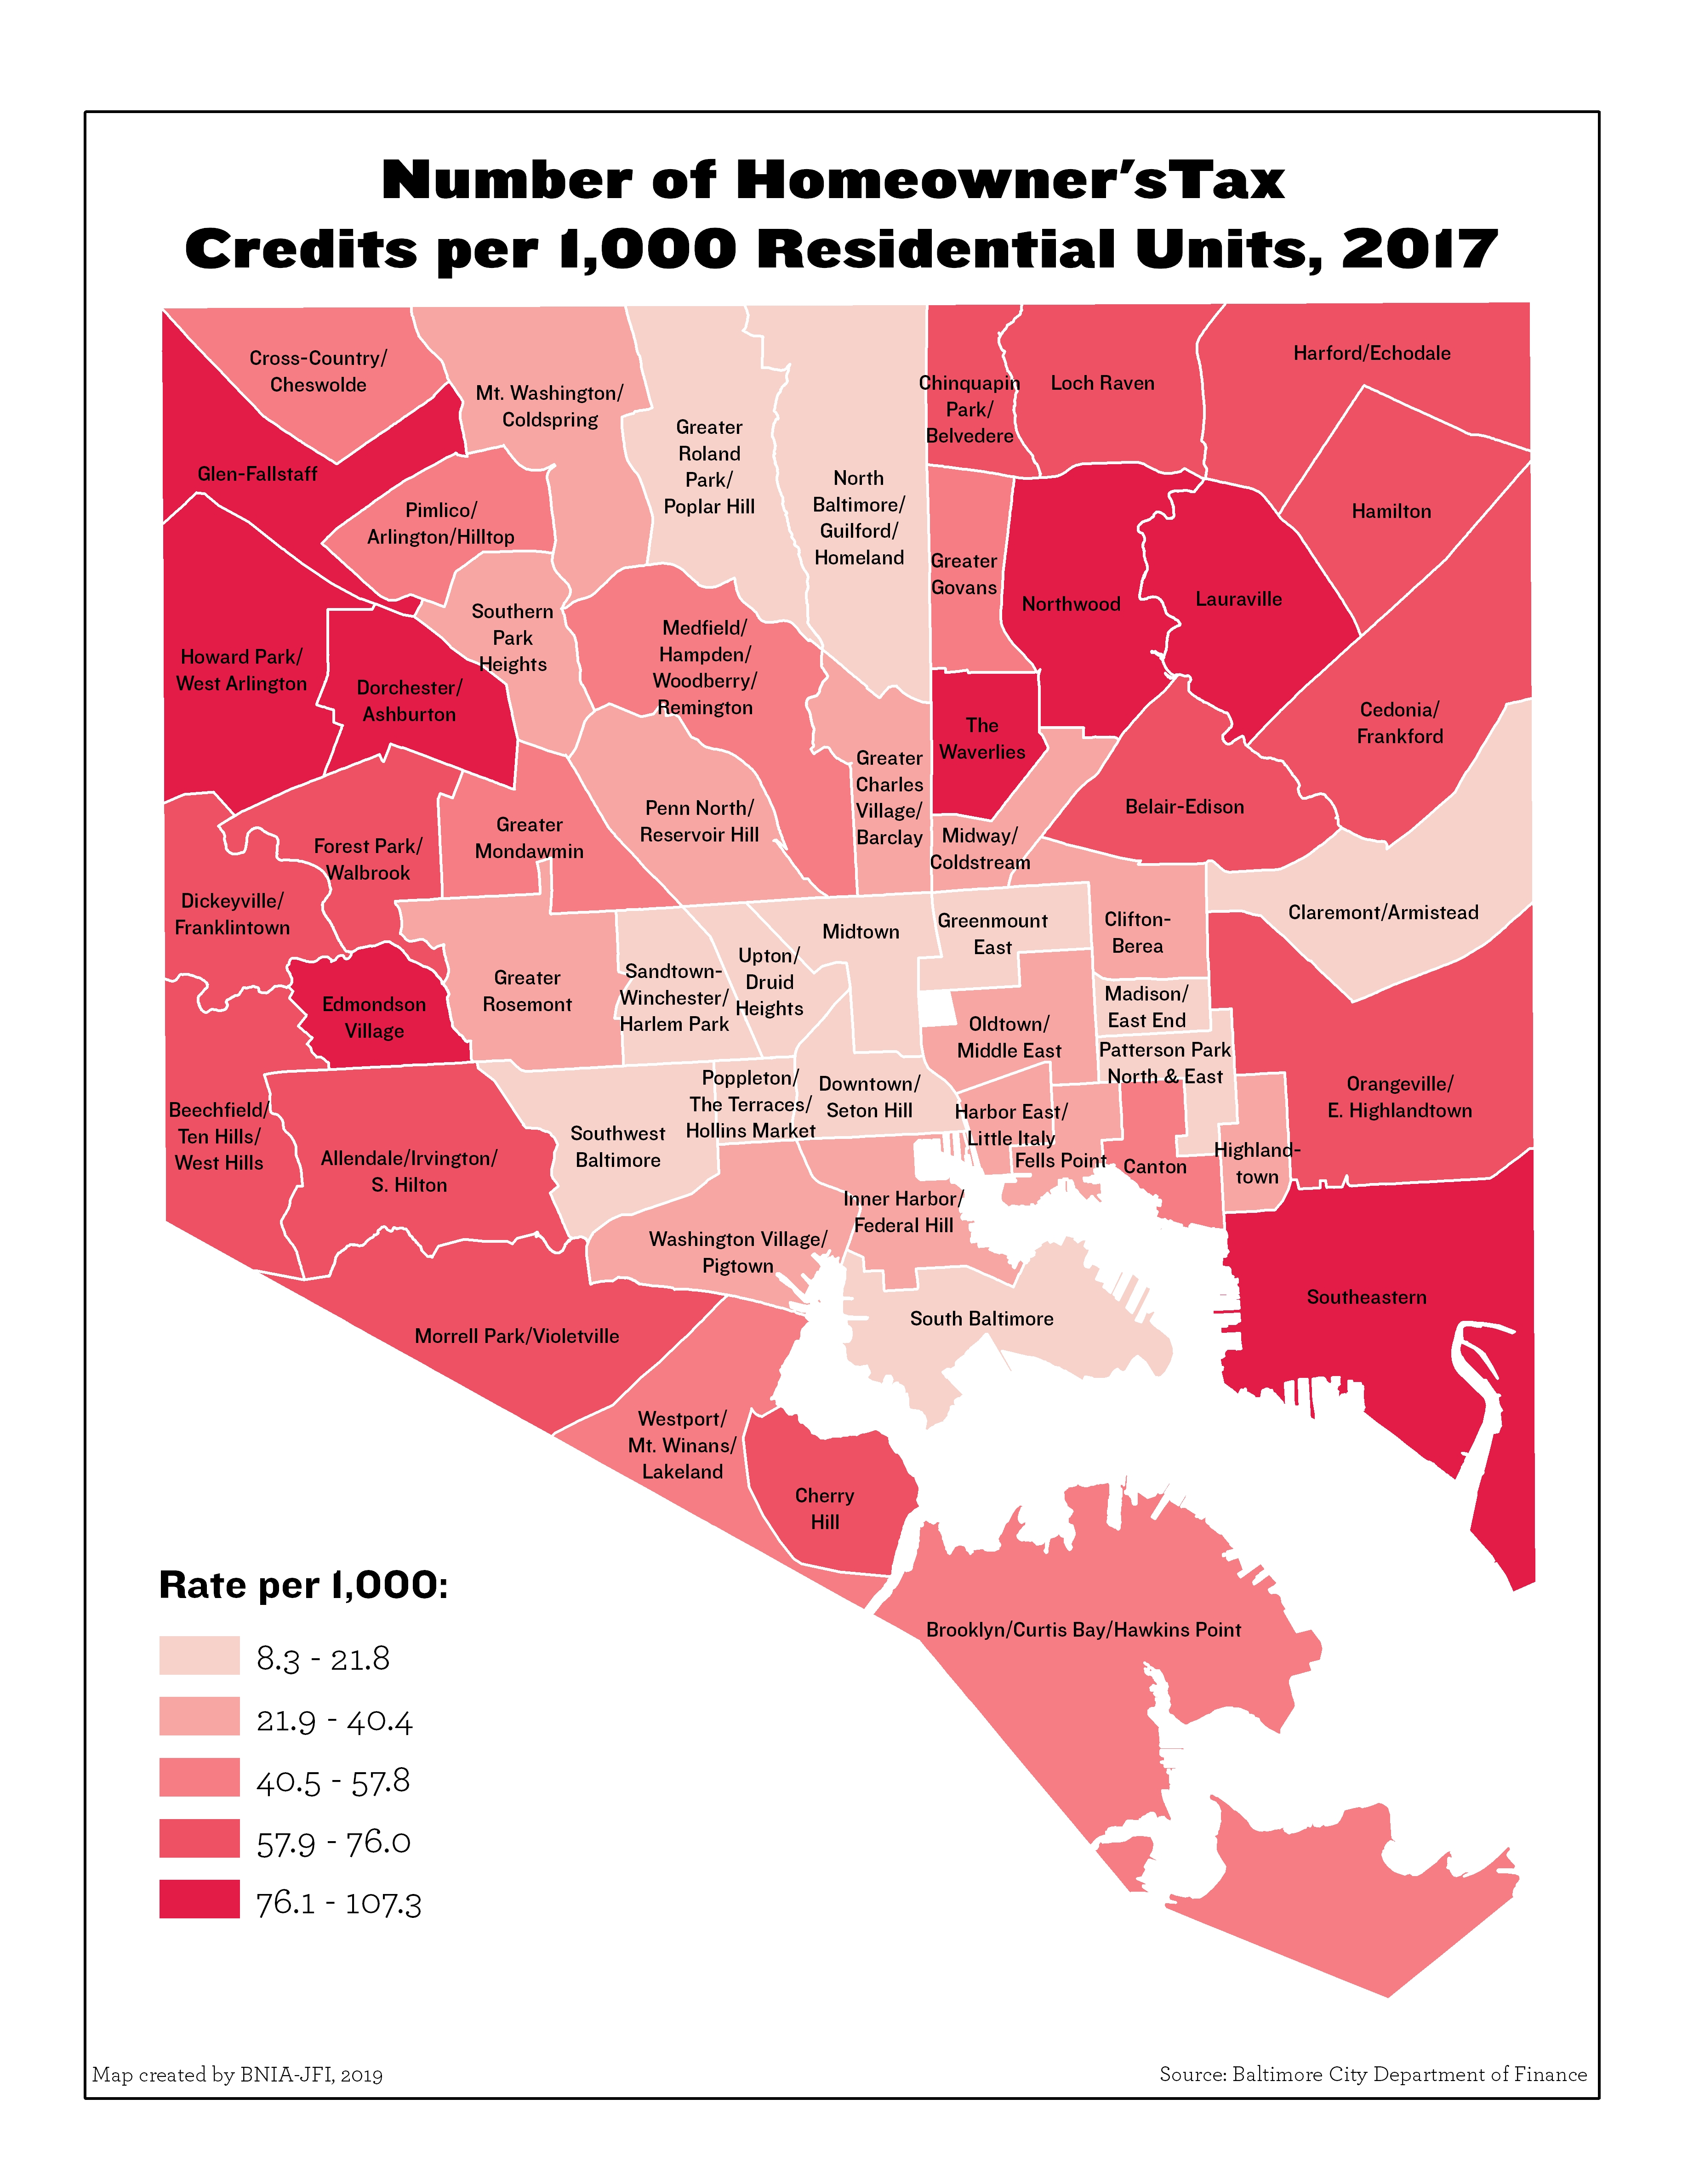
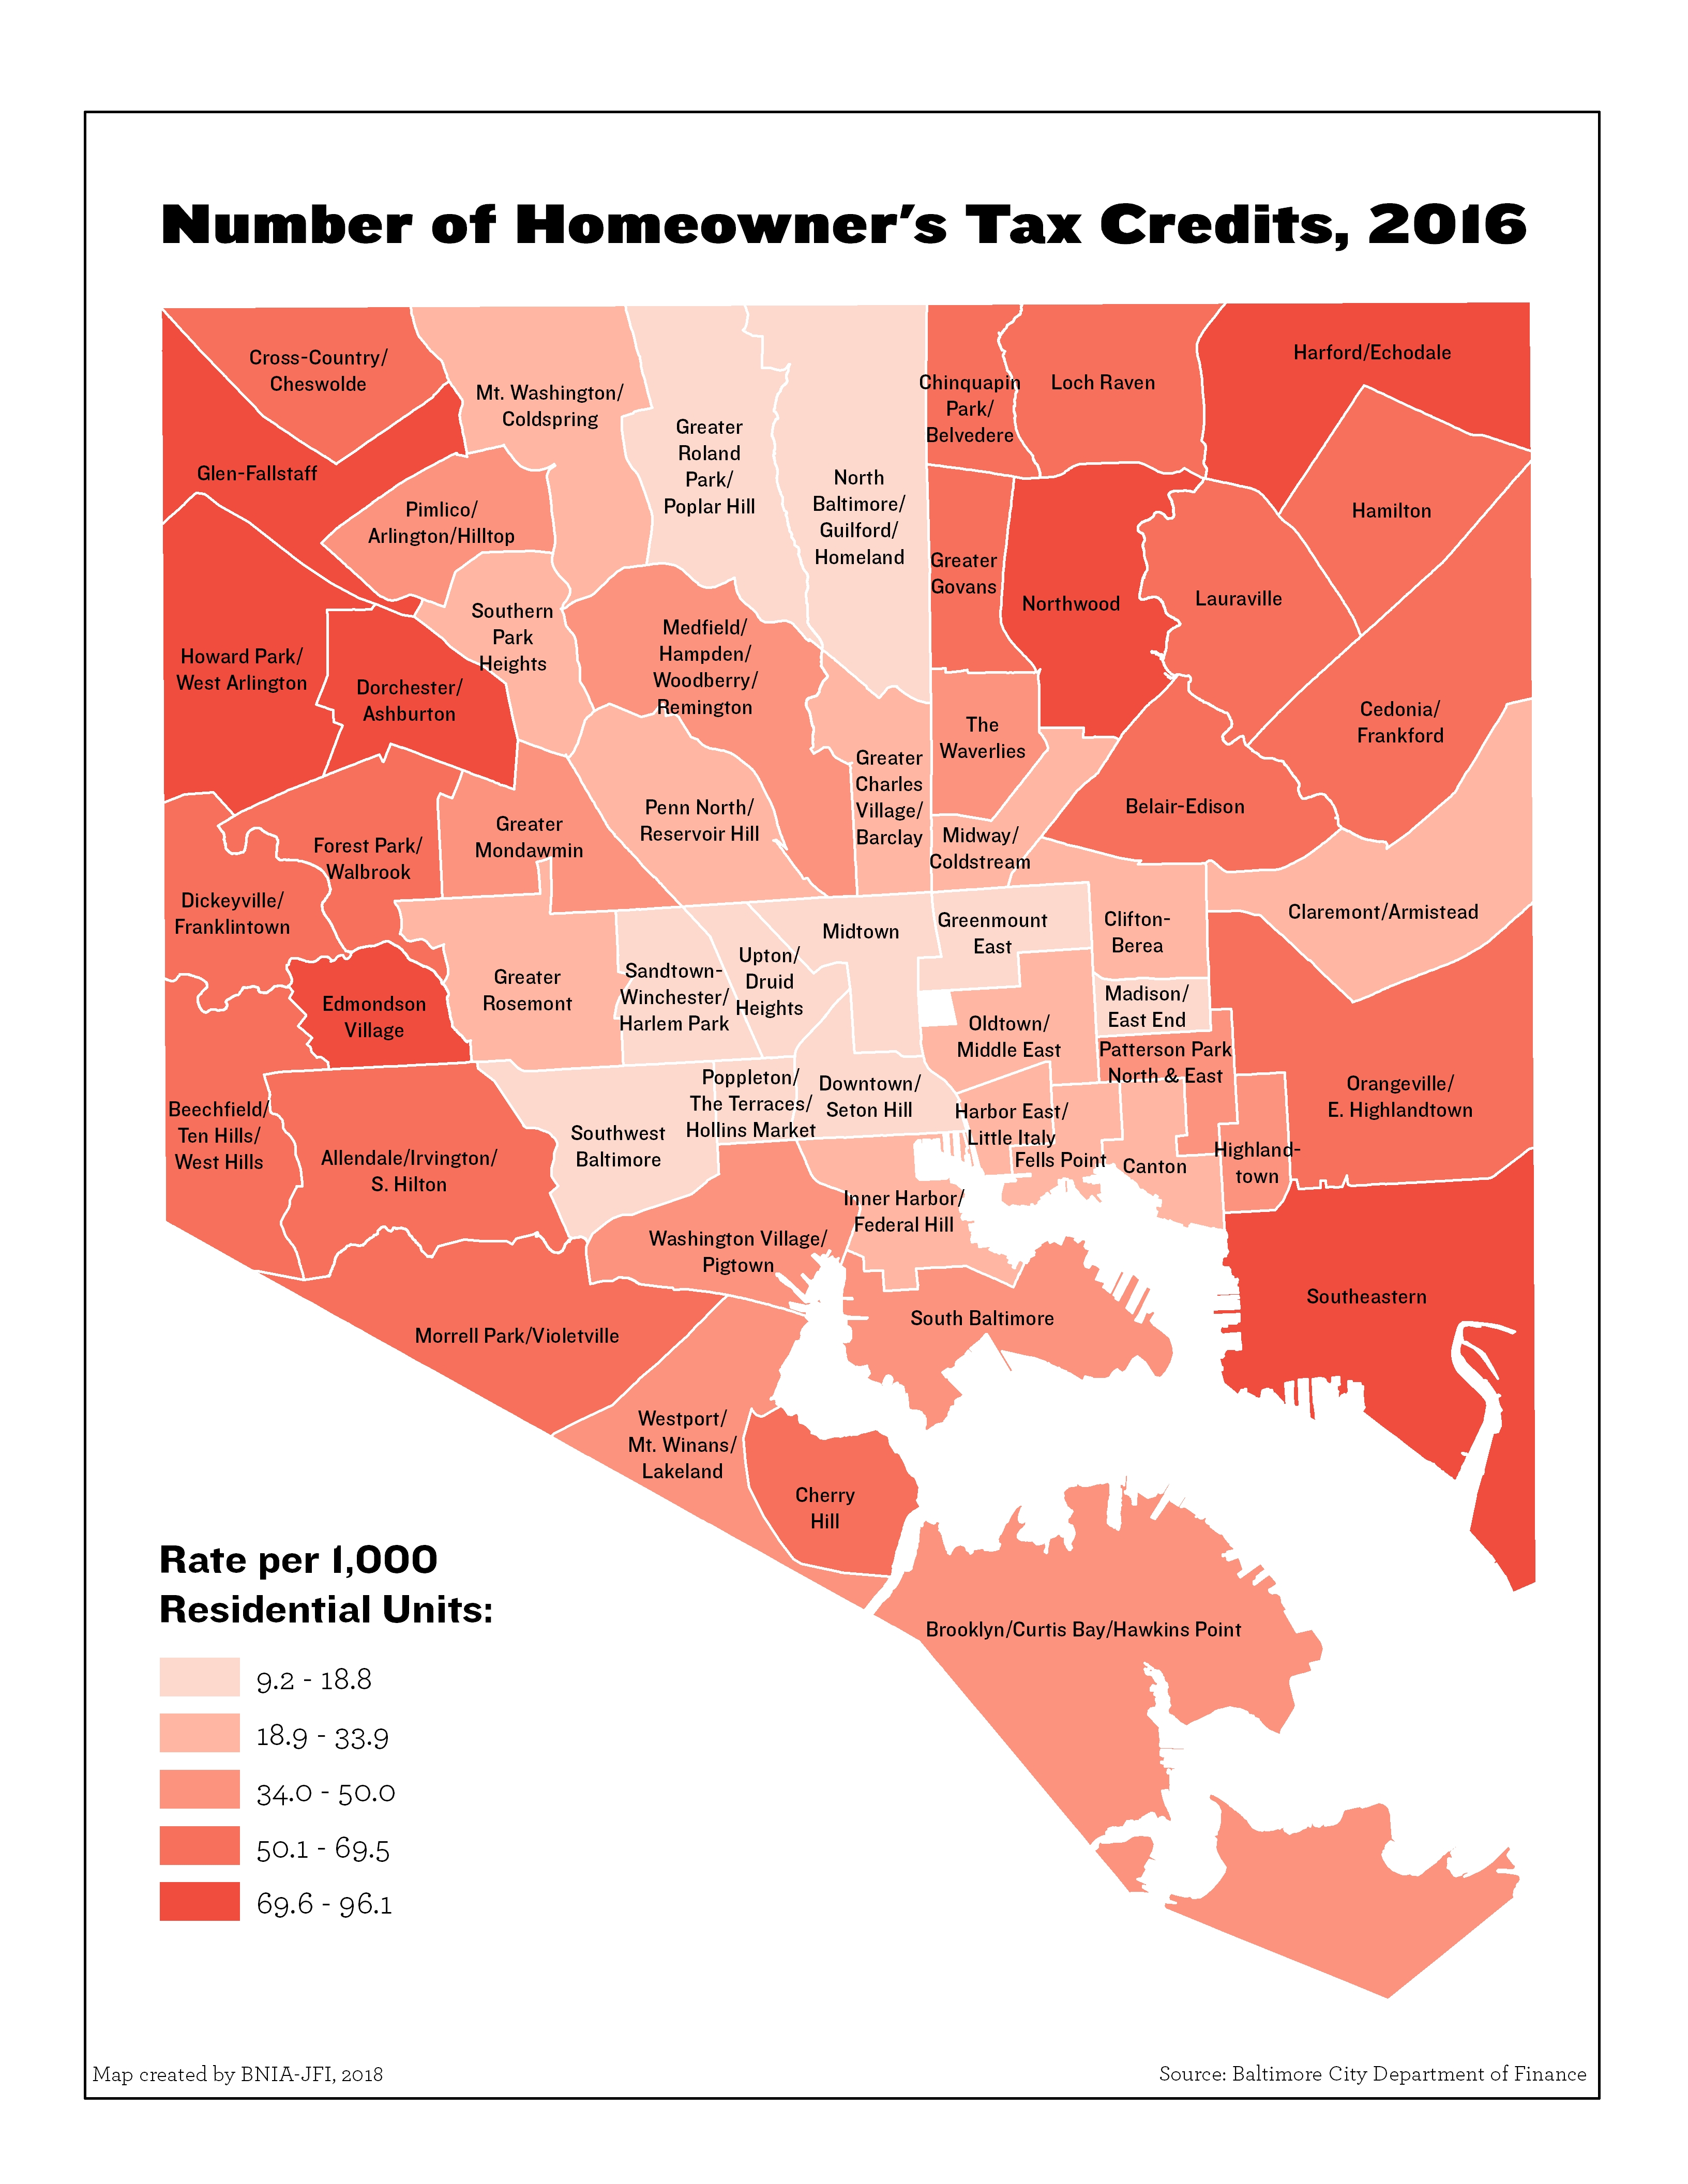
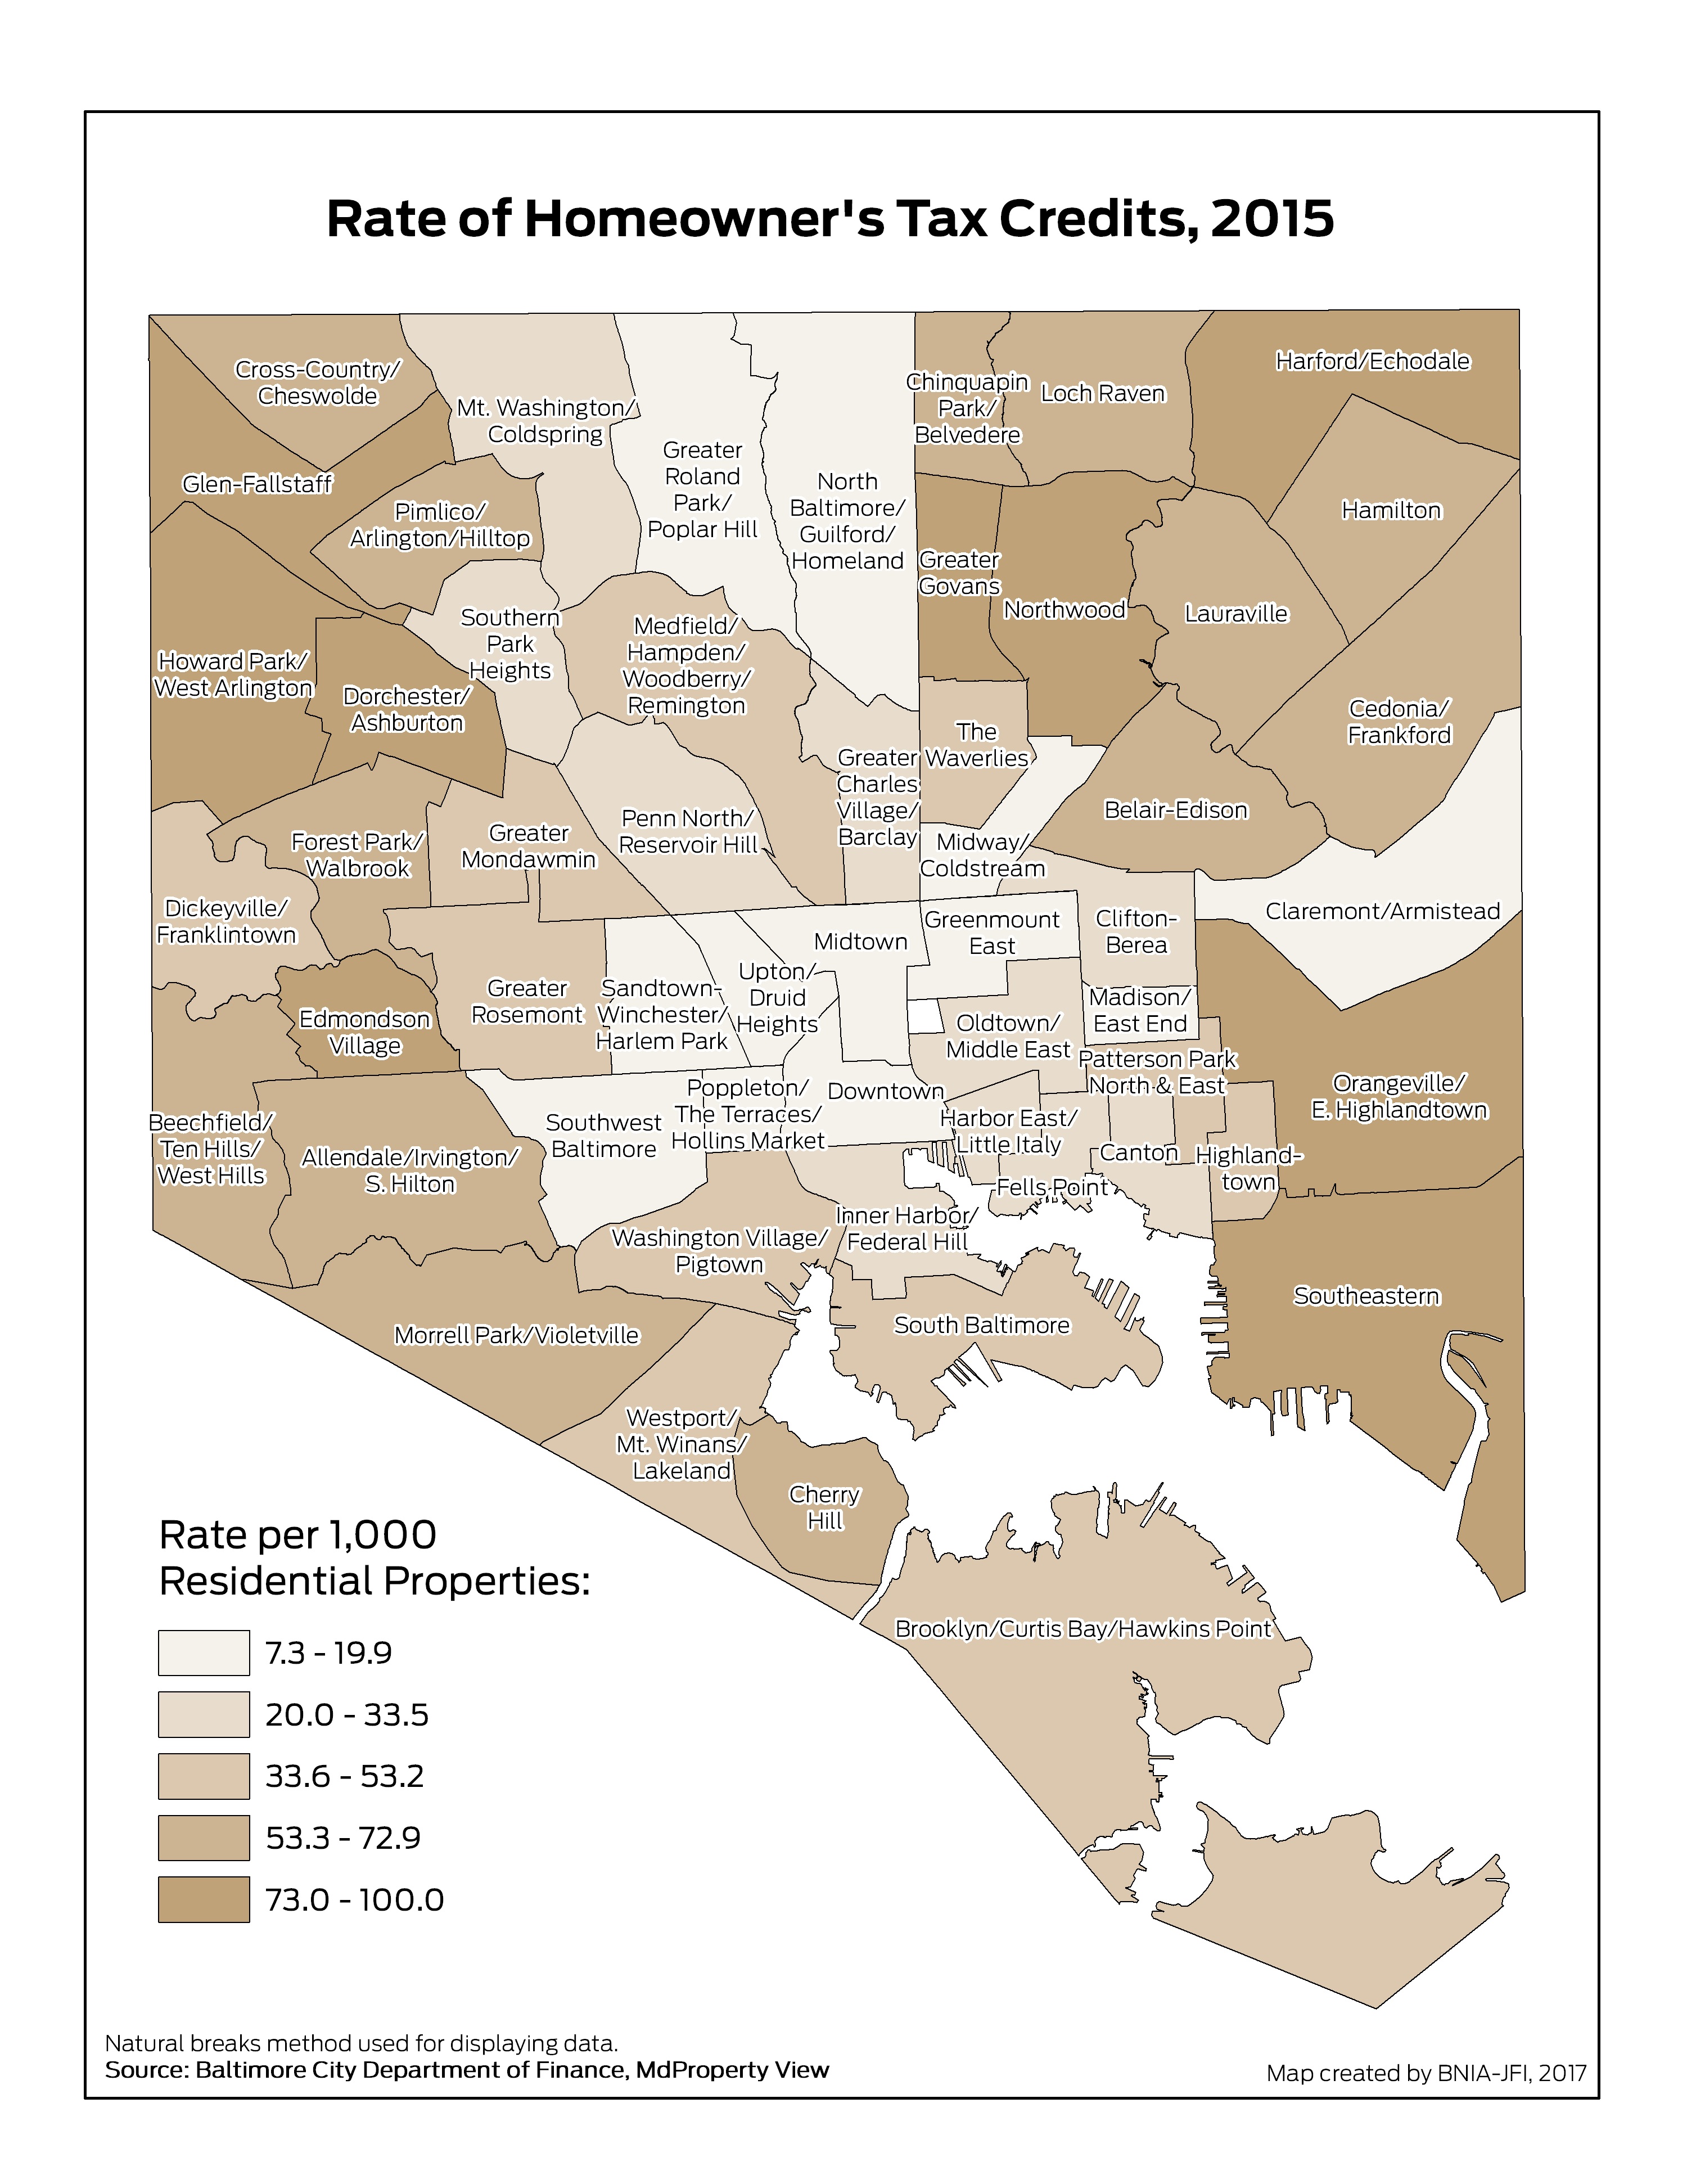
Number of Homeowner’s Tax Credits per 1,000 Residential Units
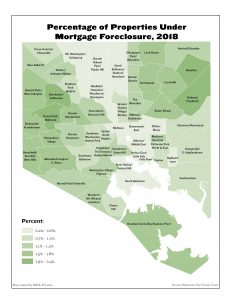
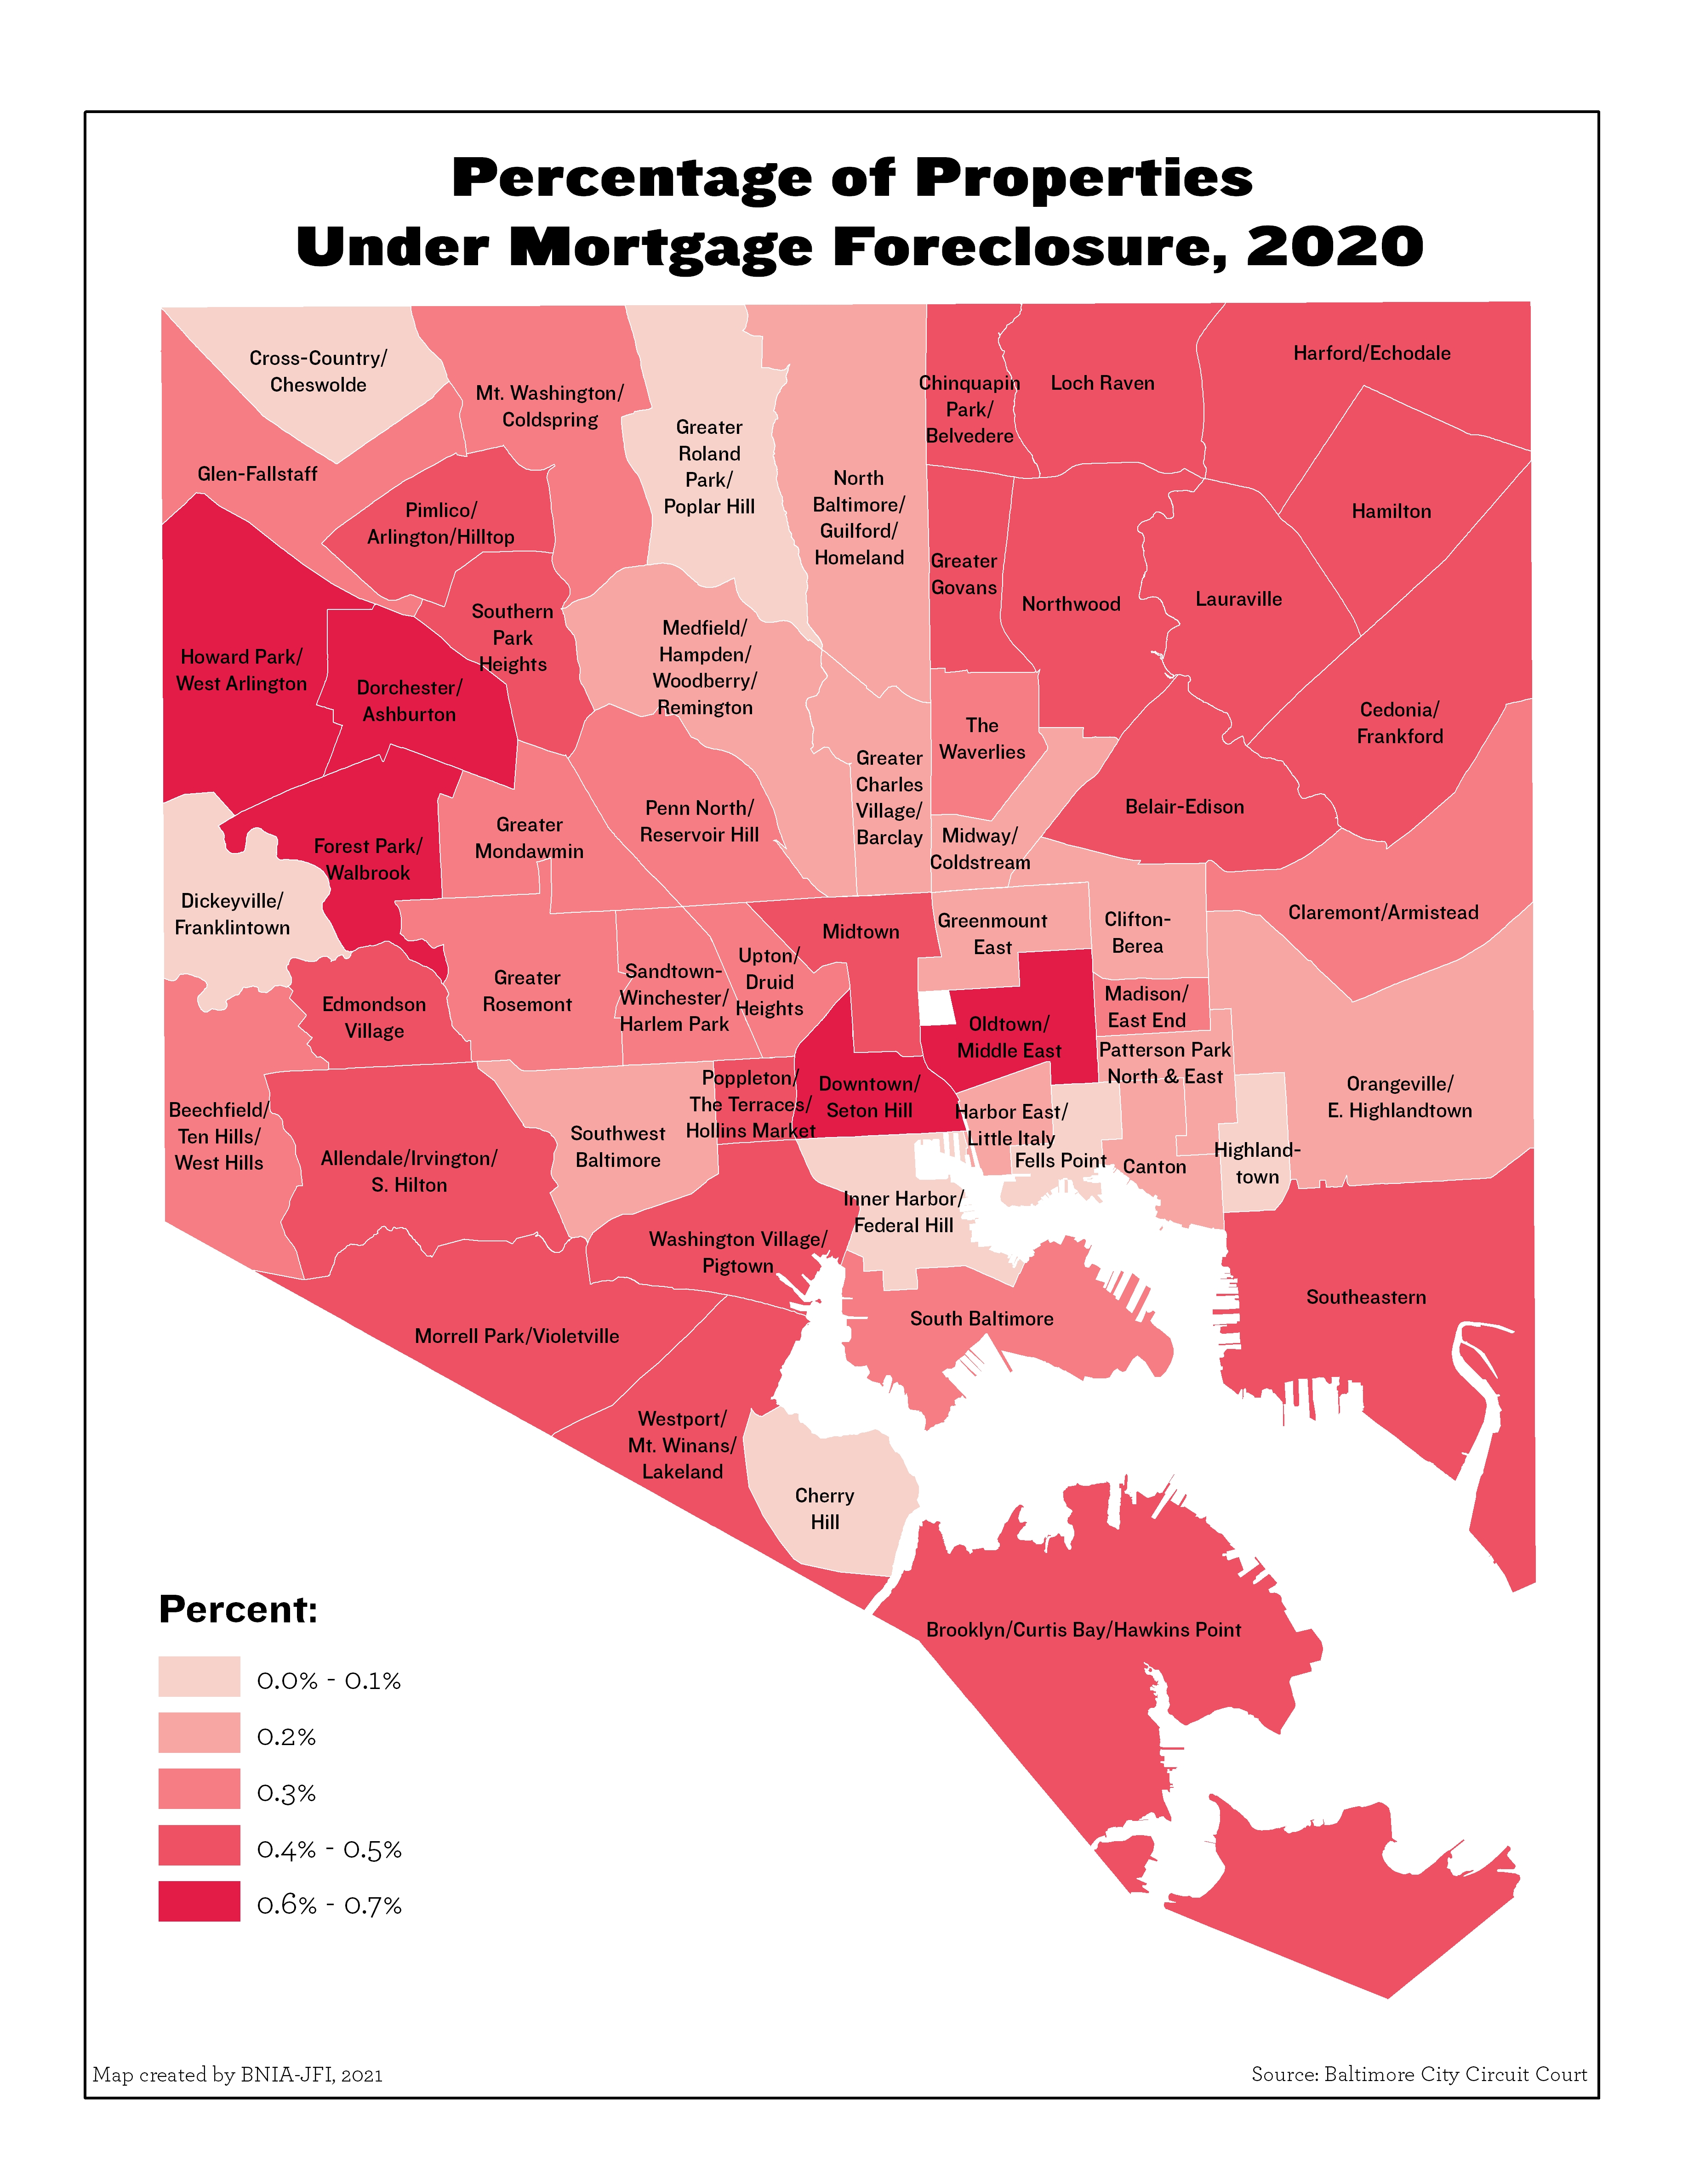
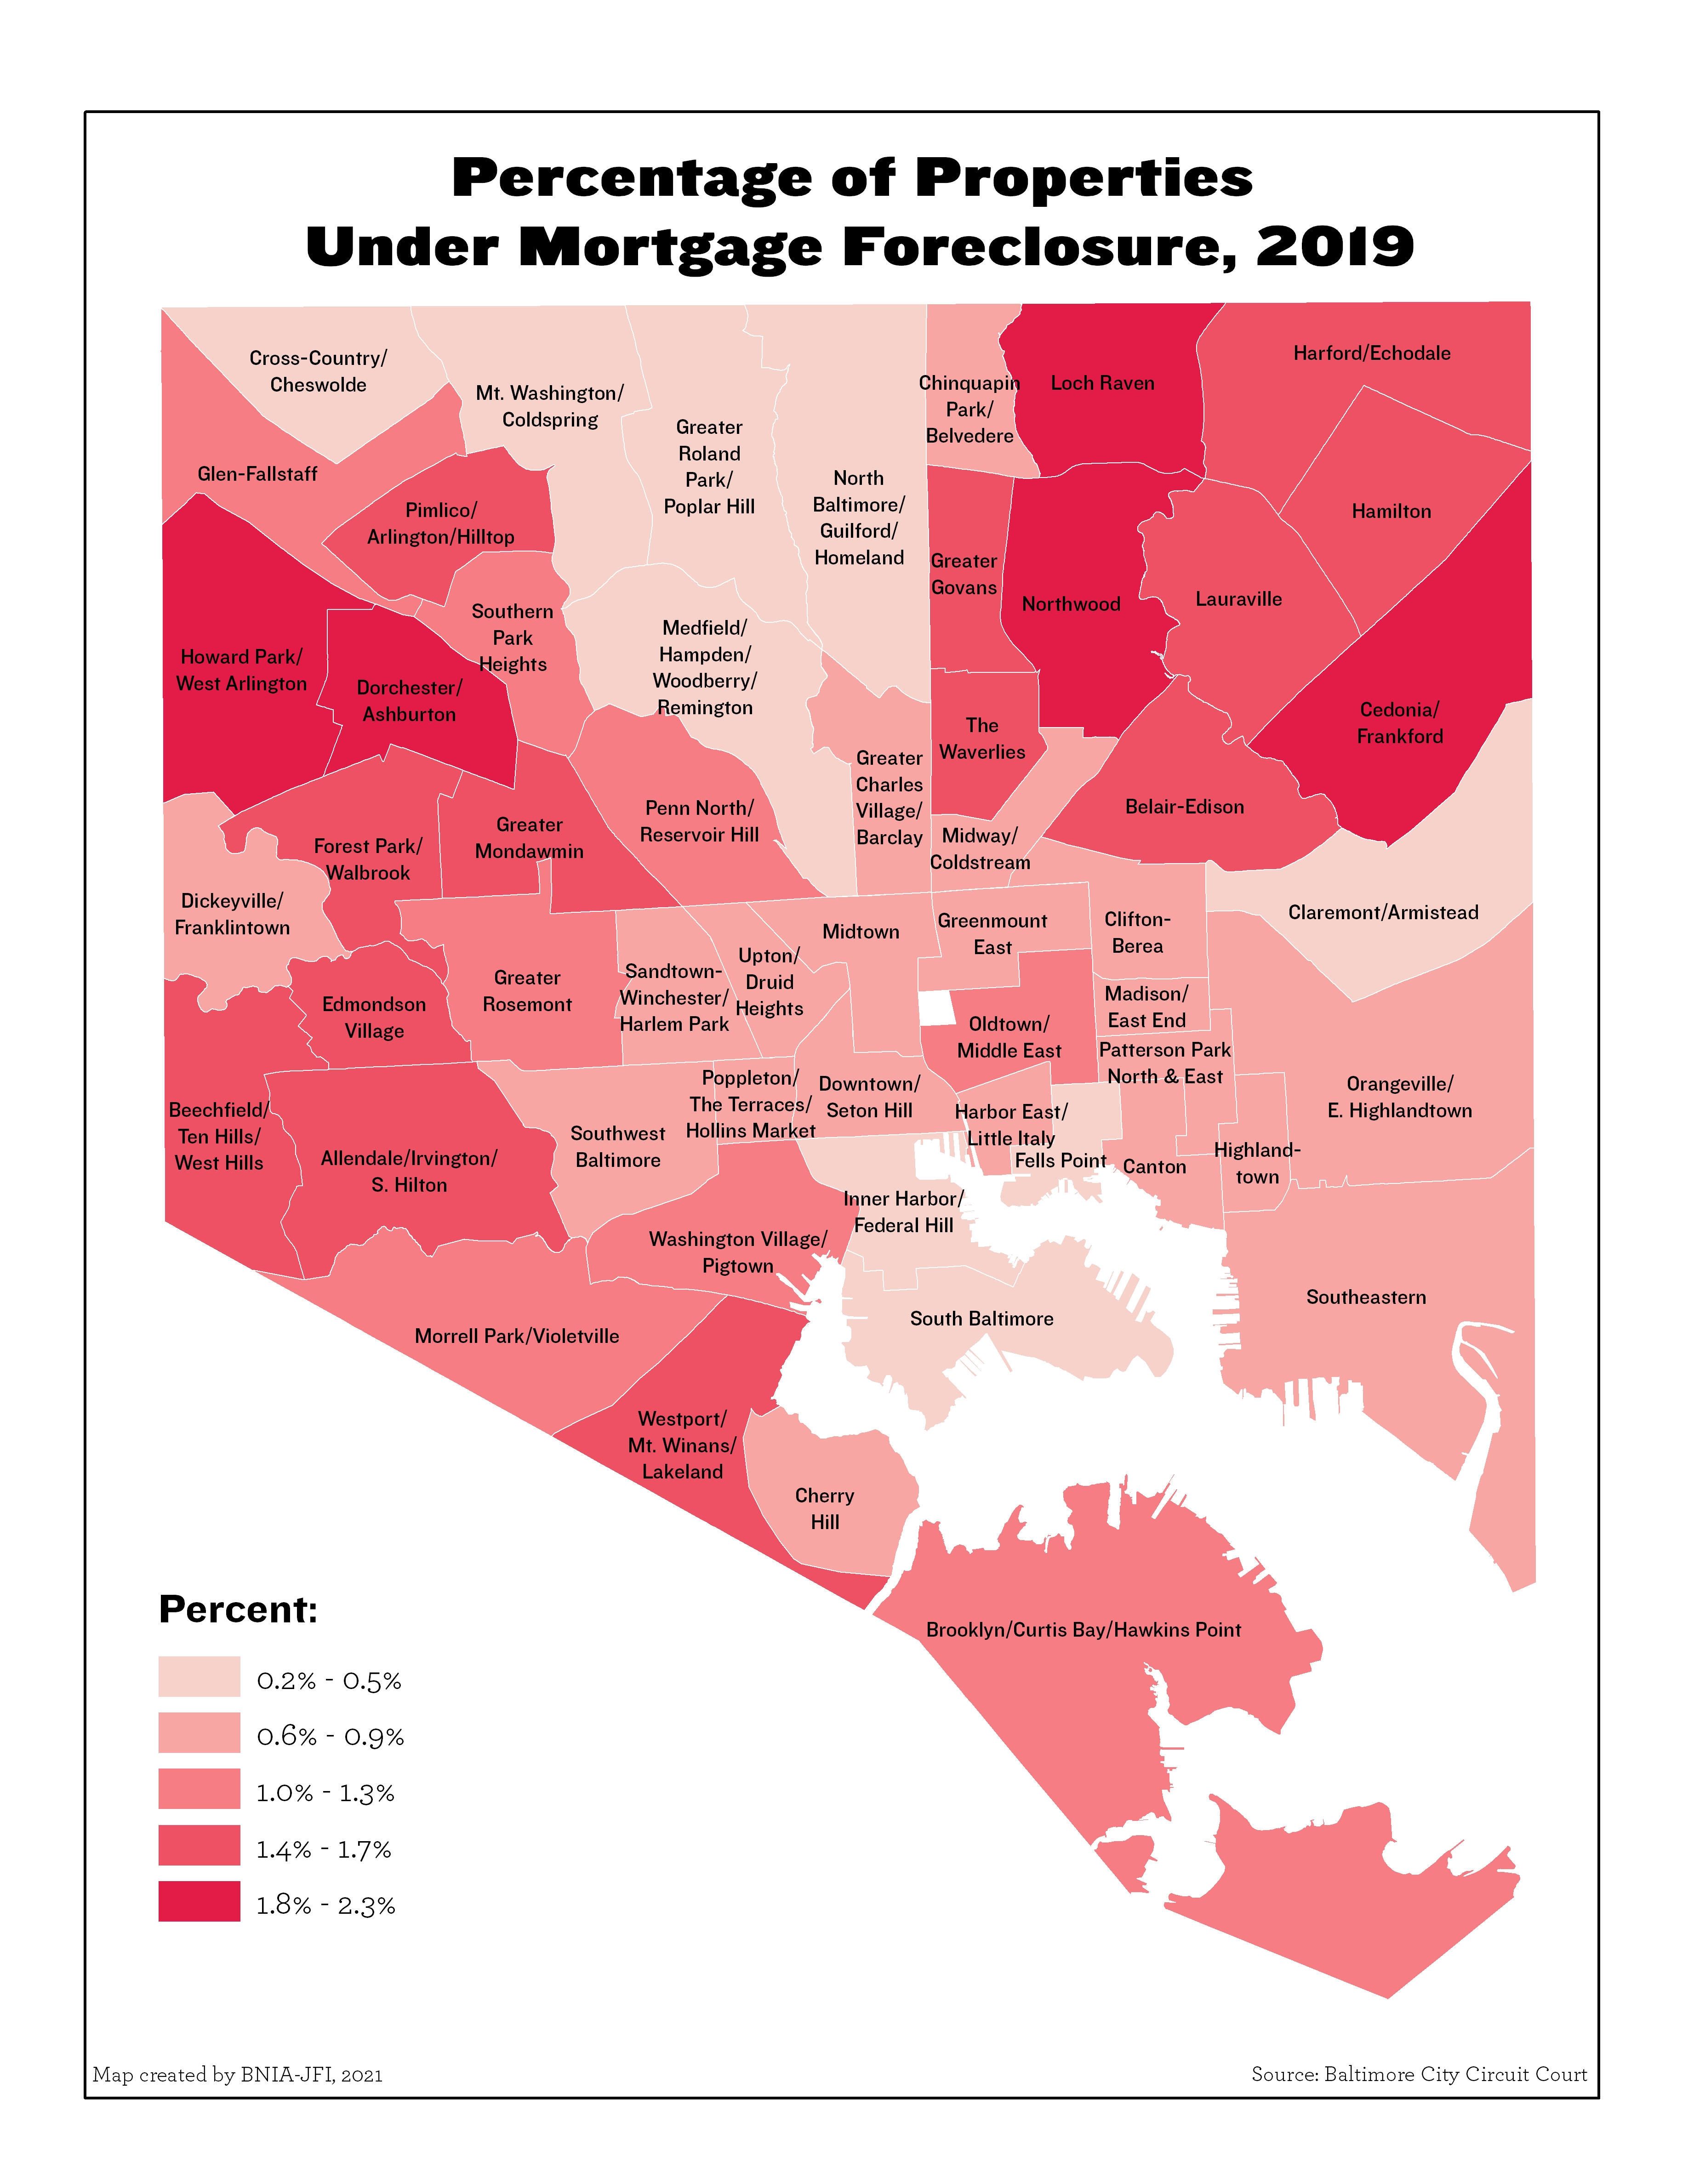
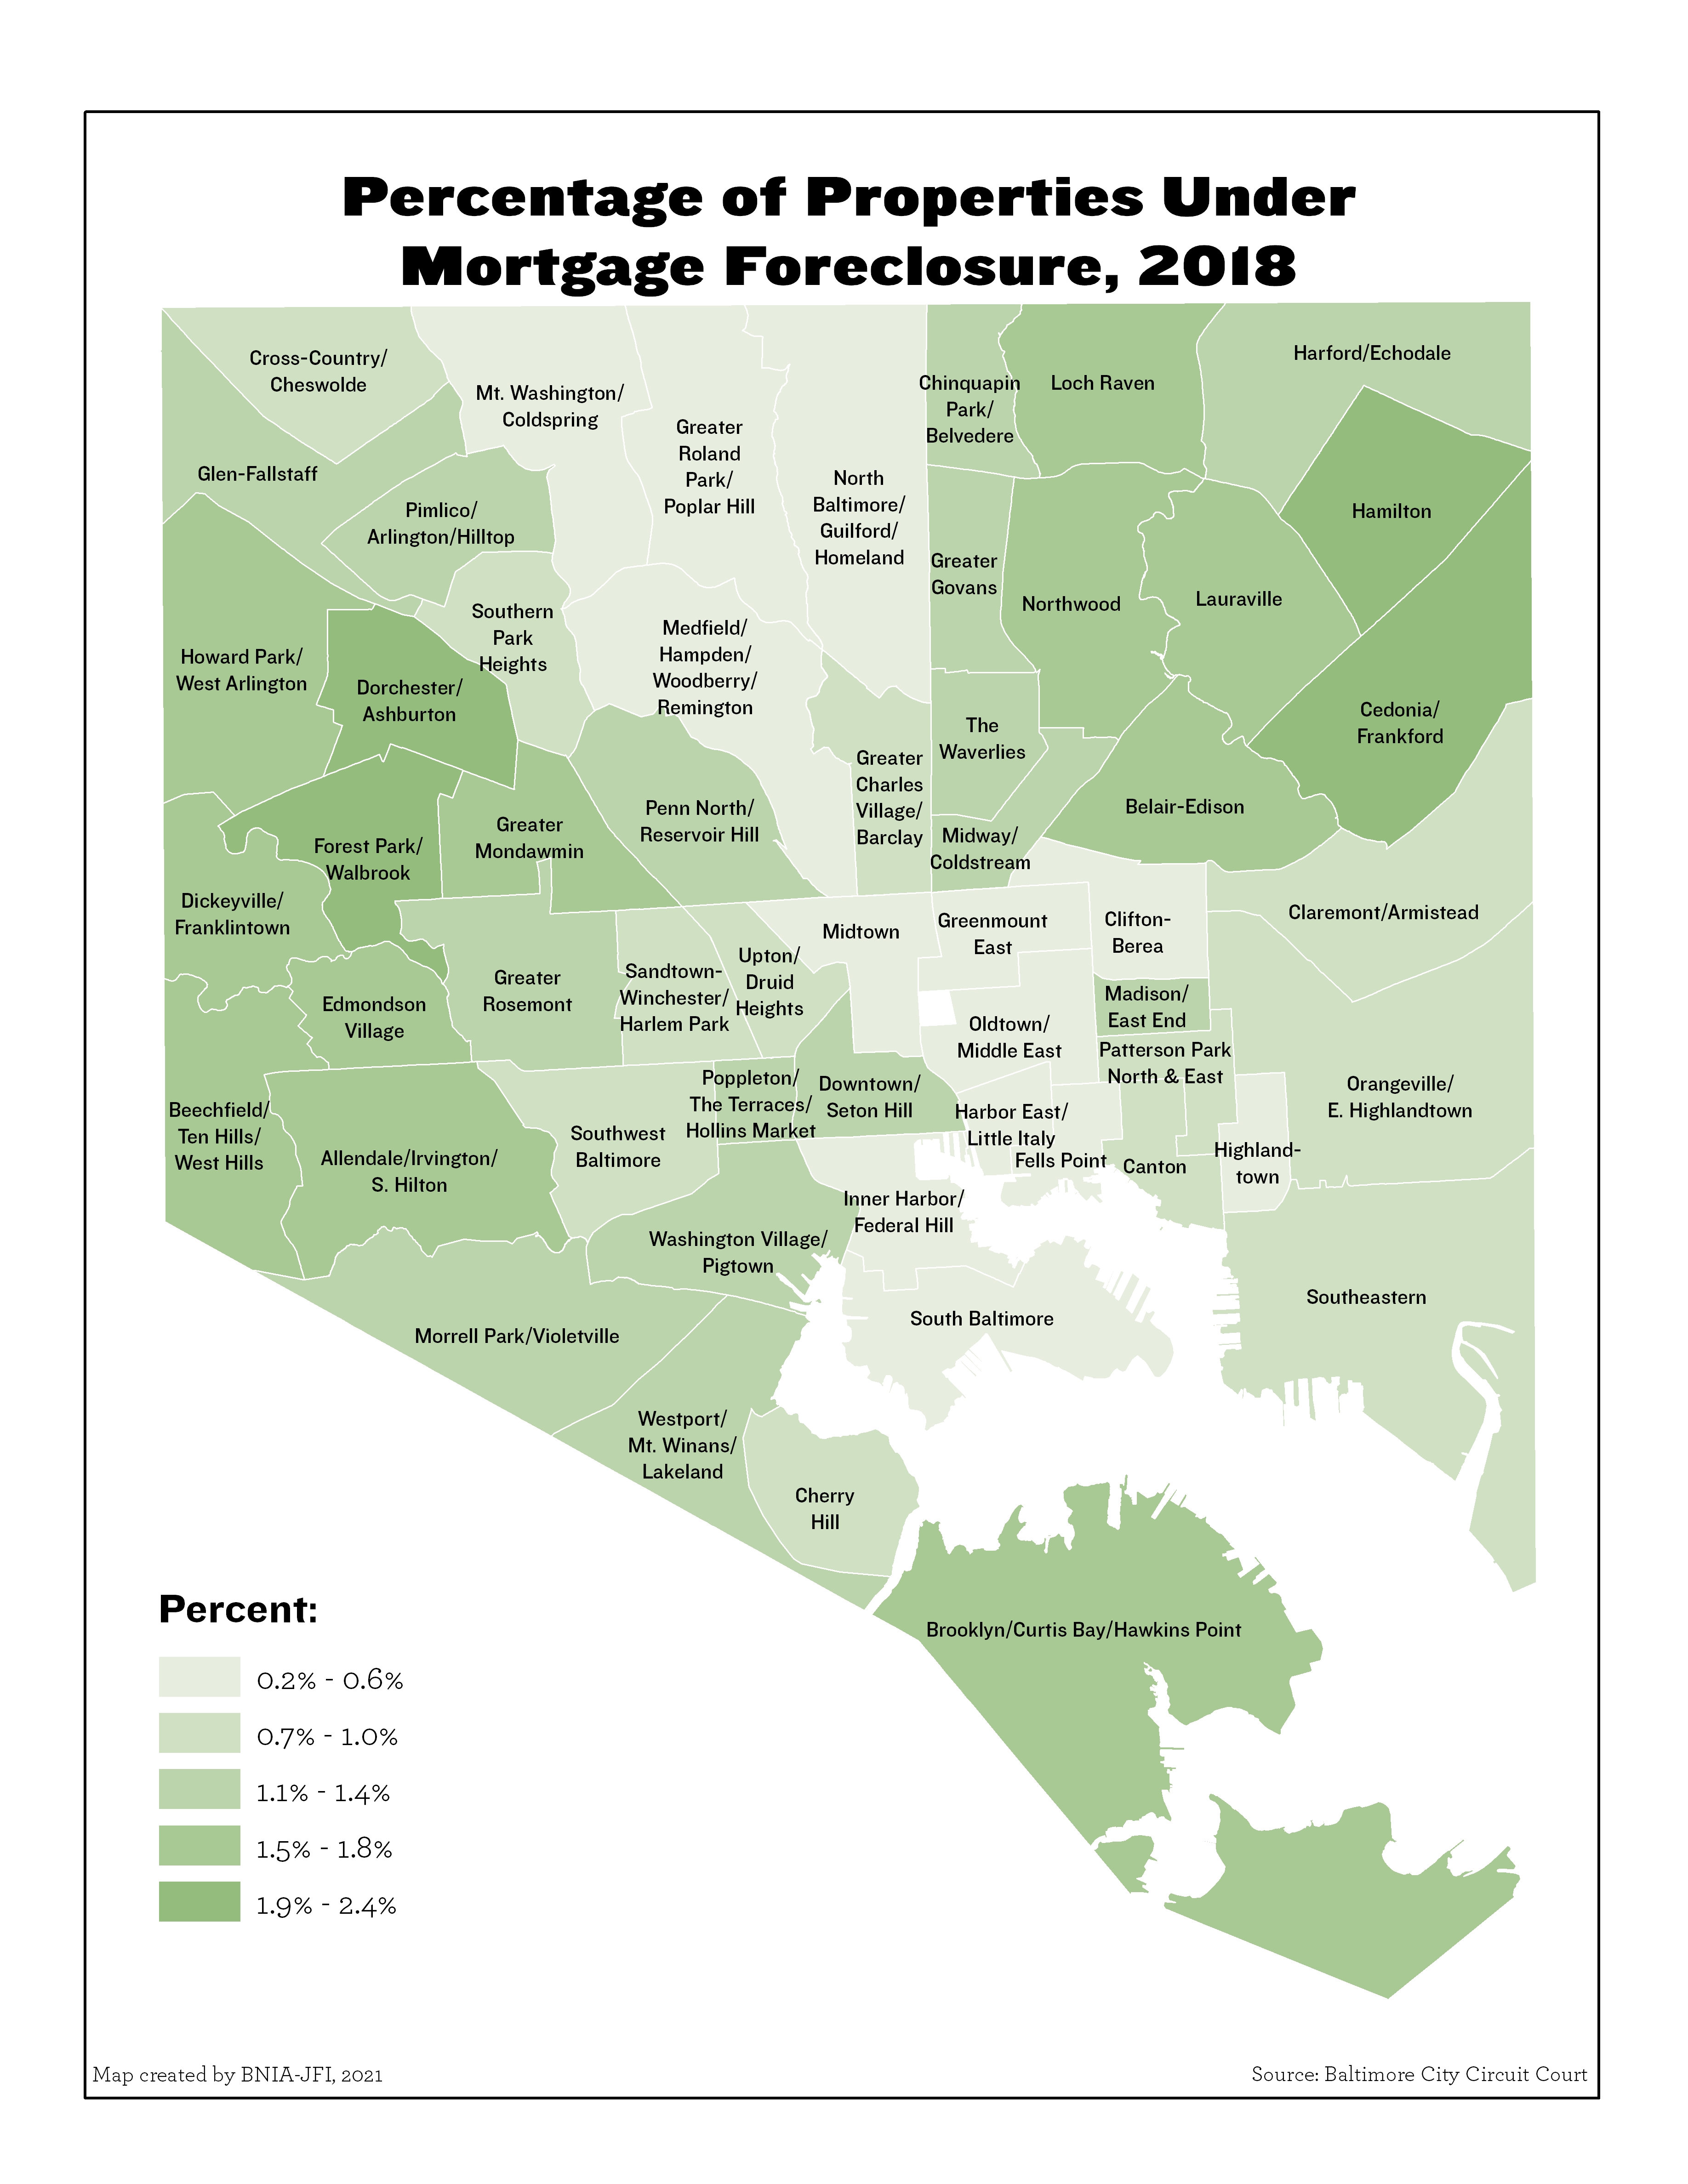
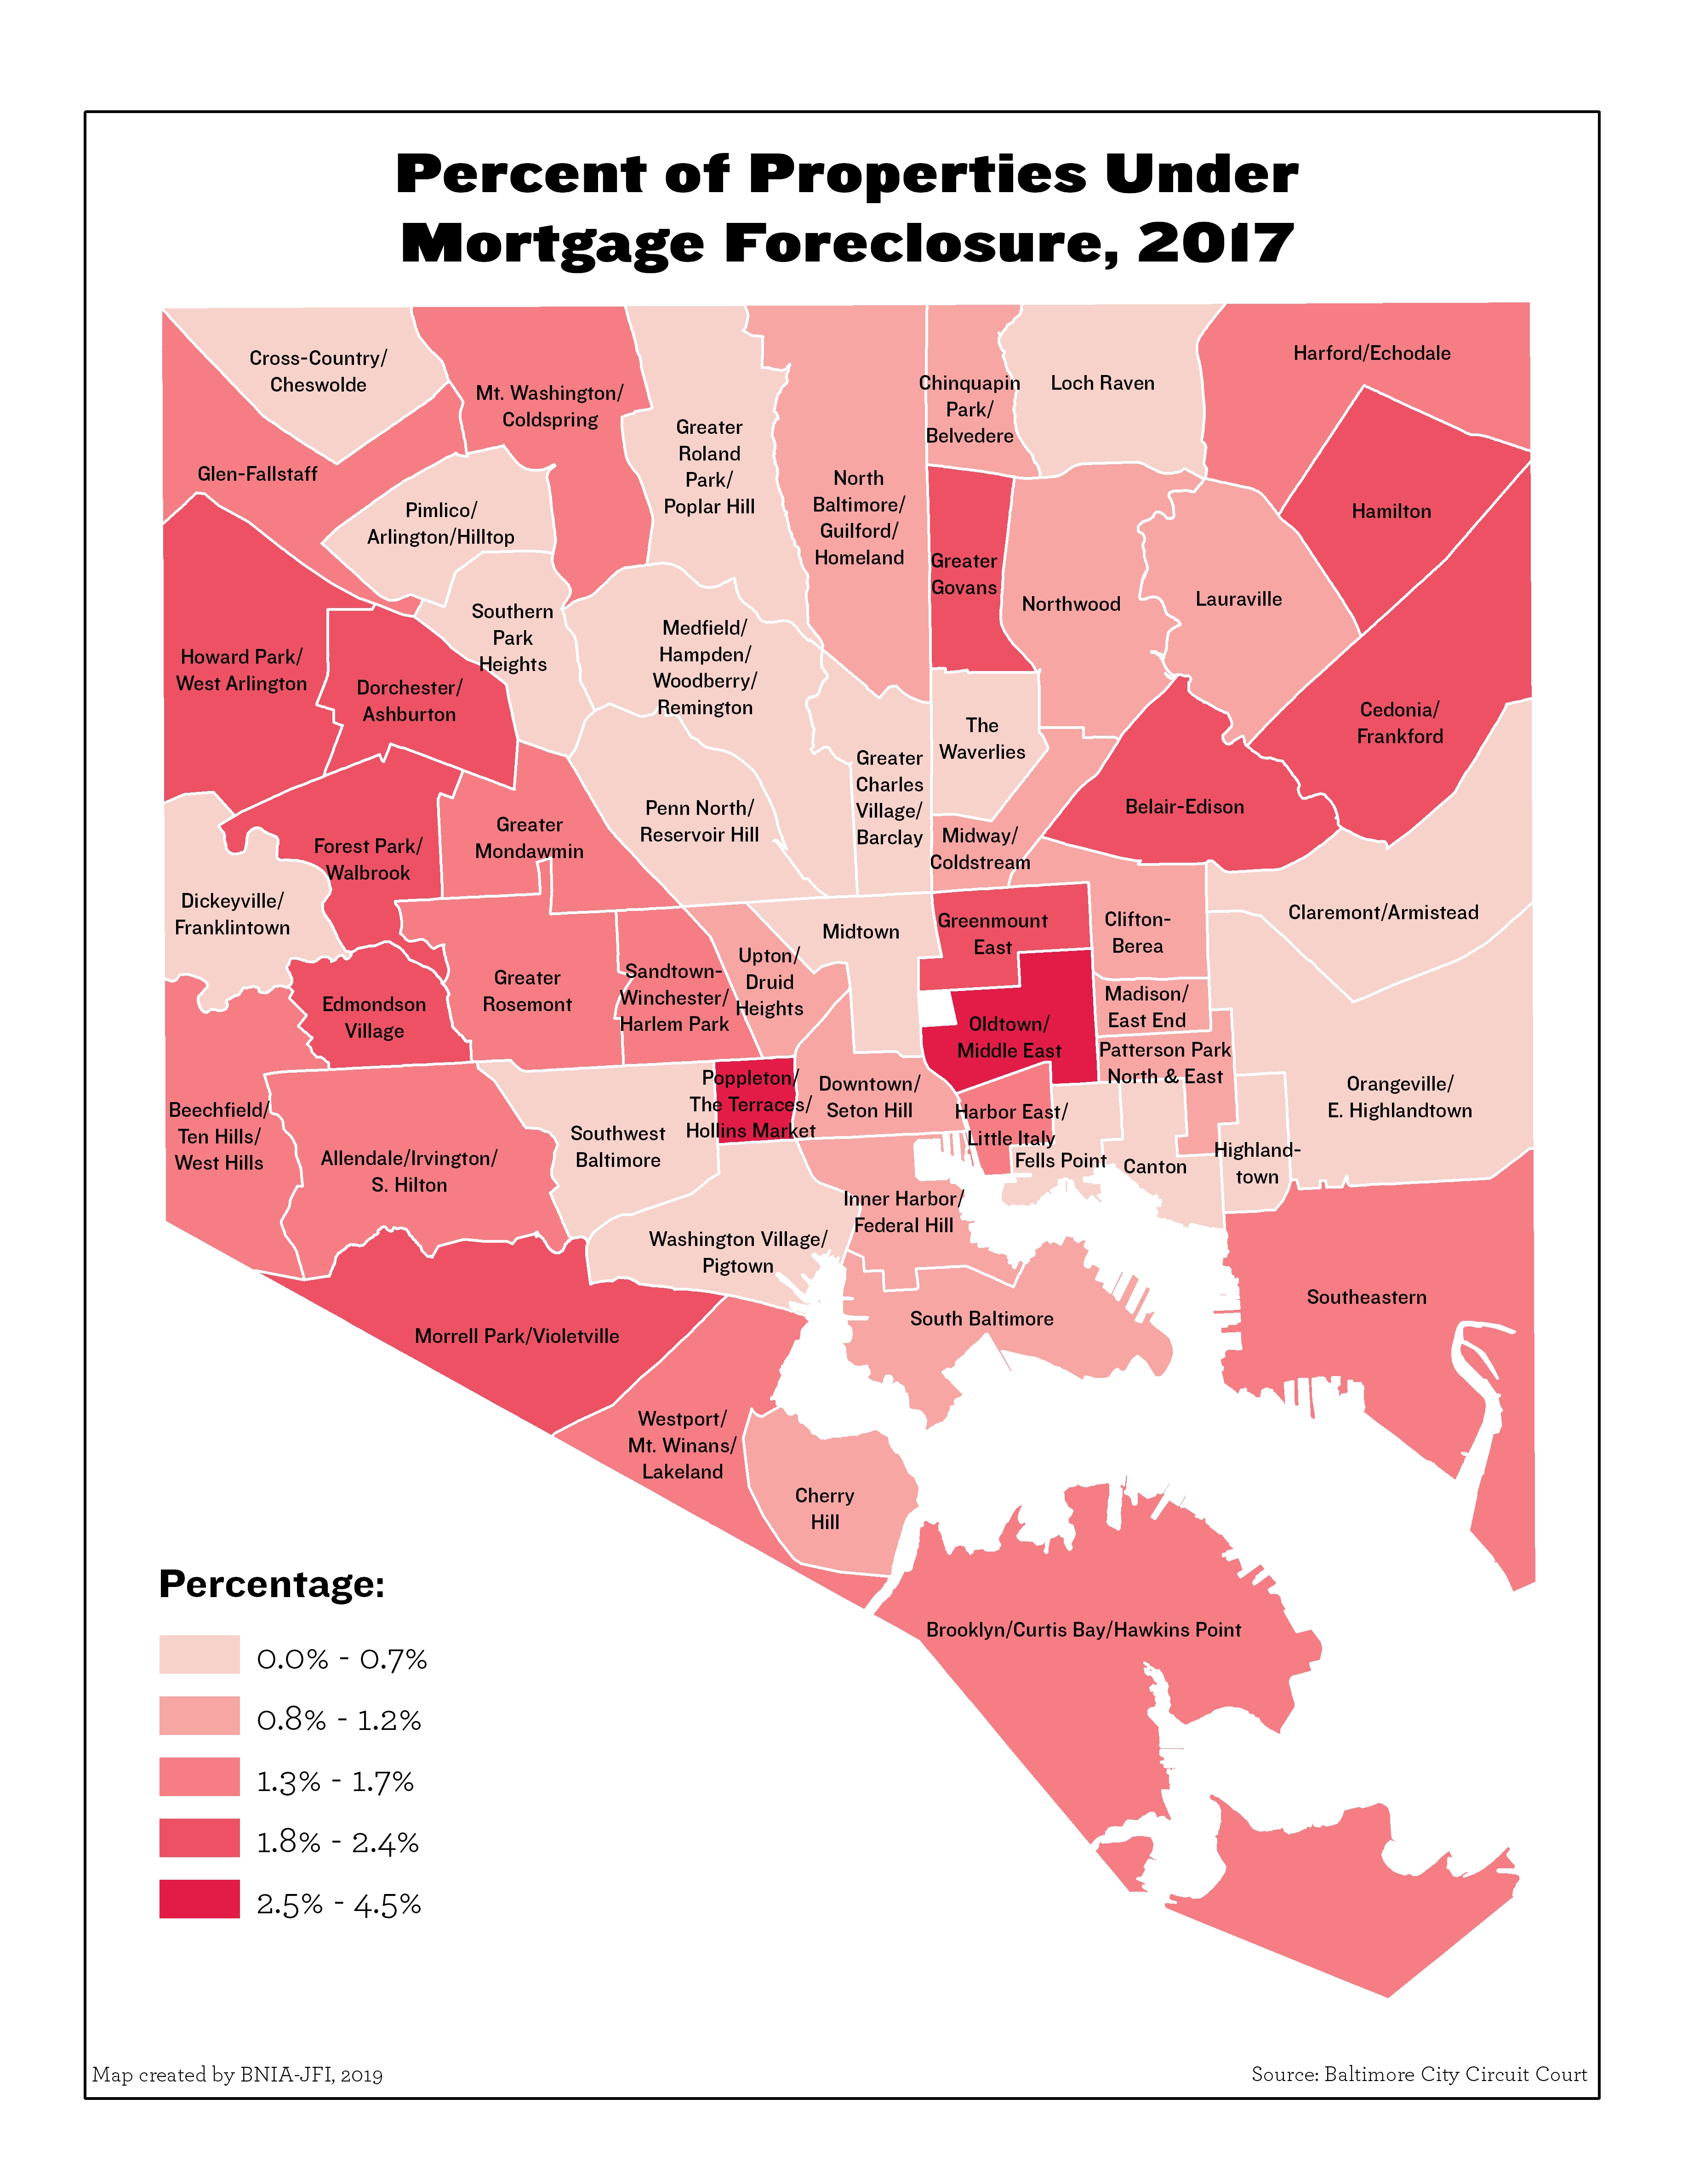
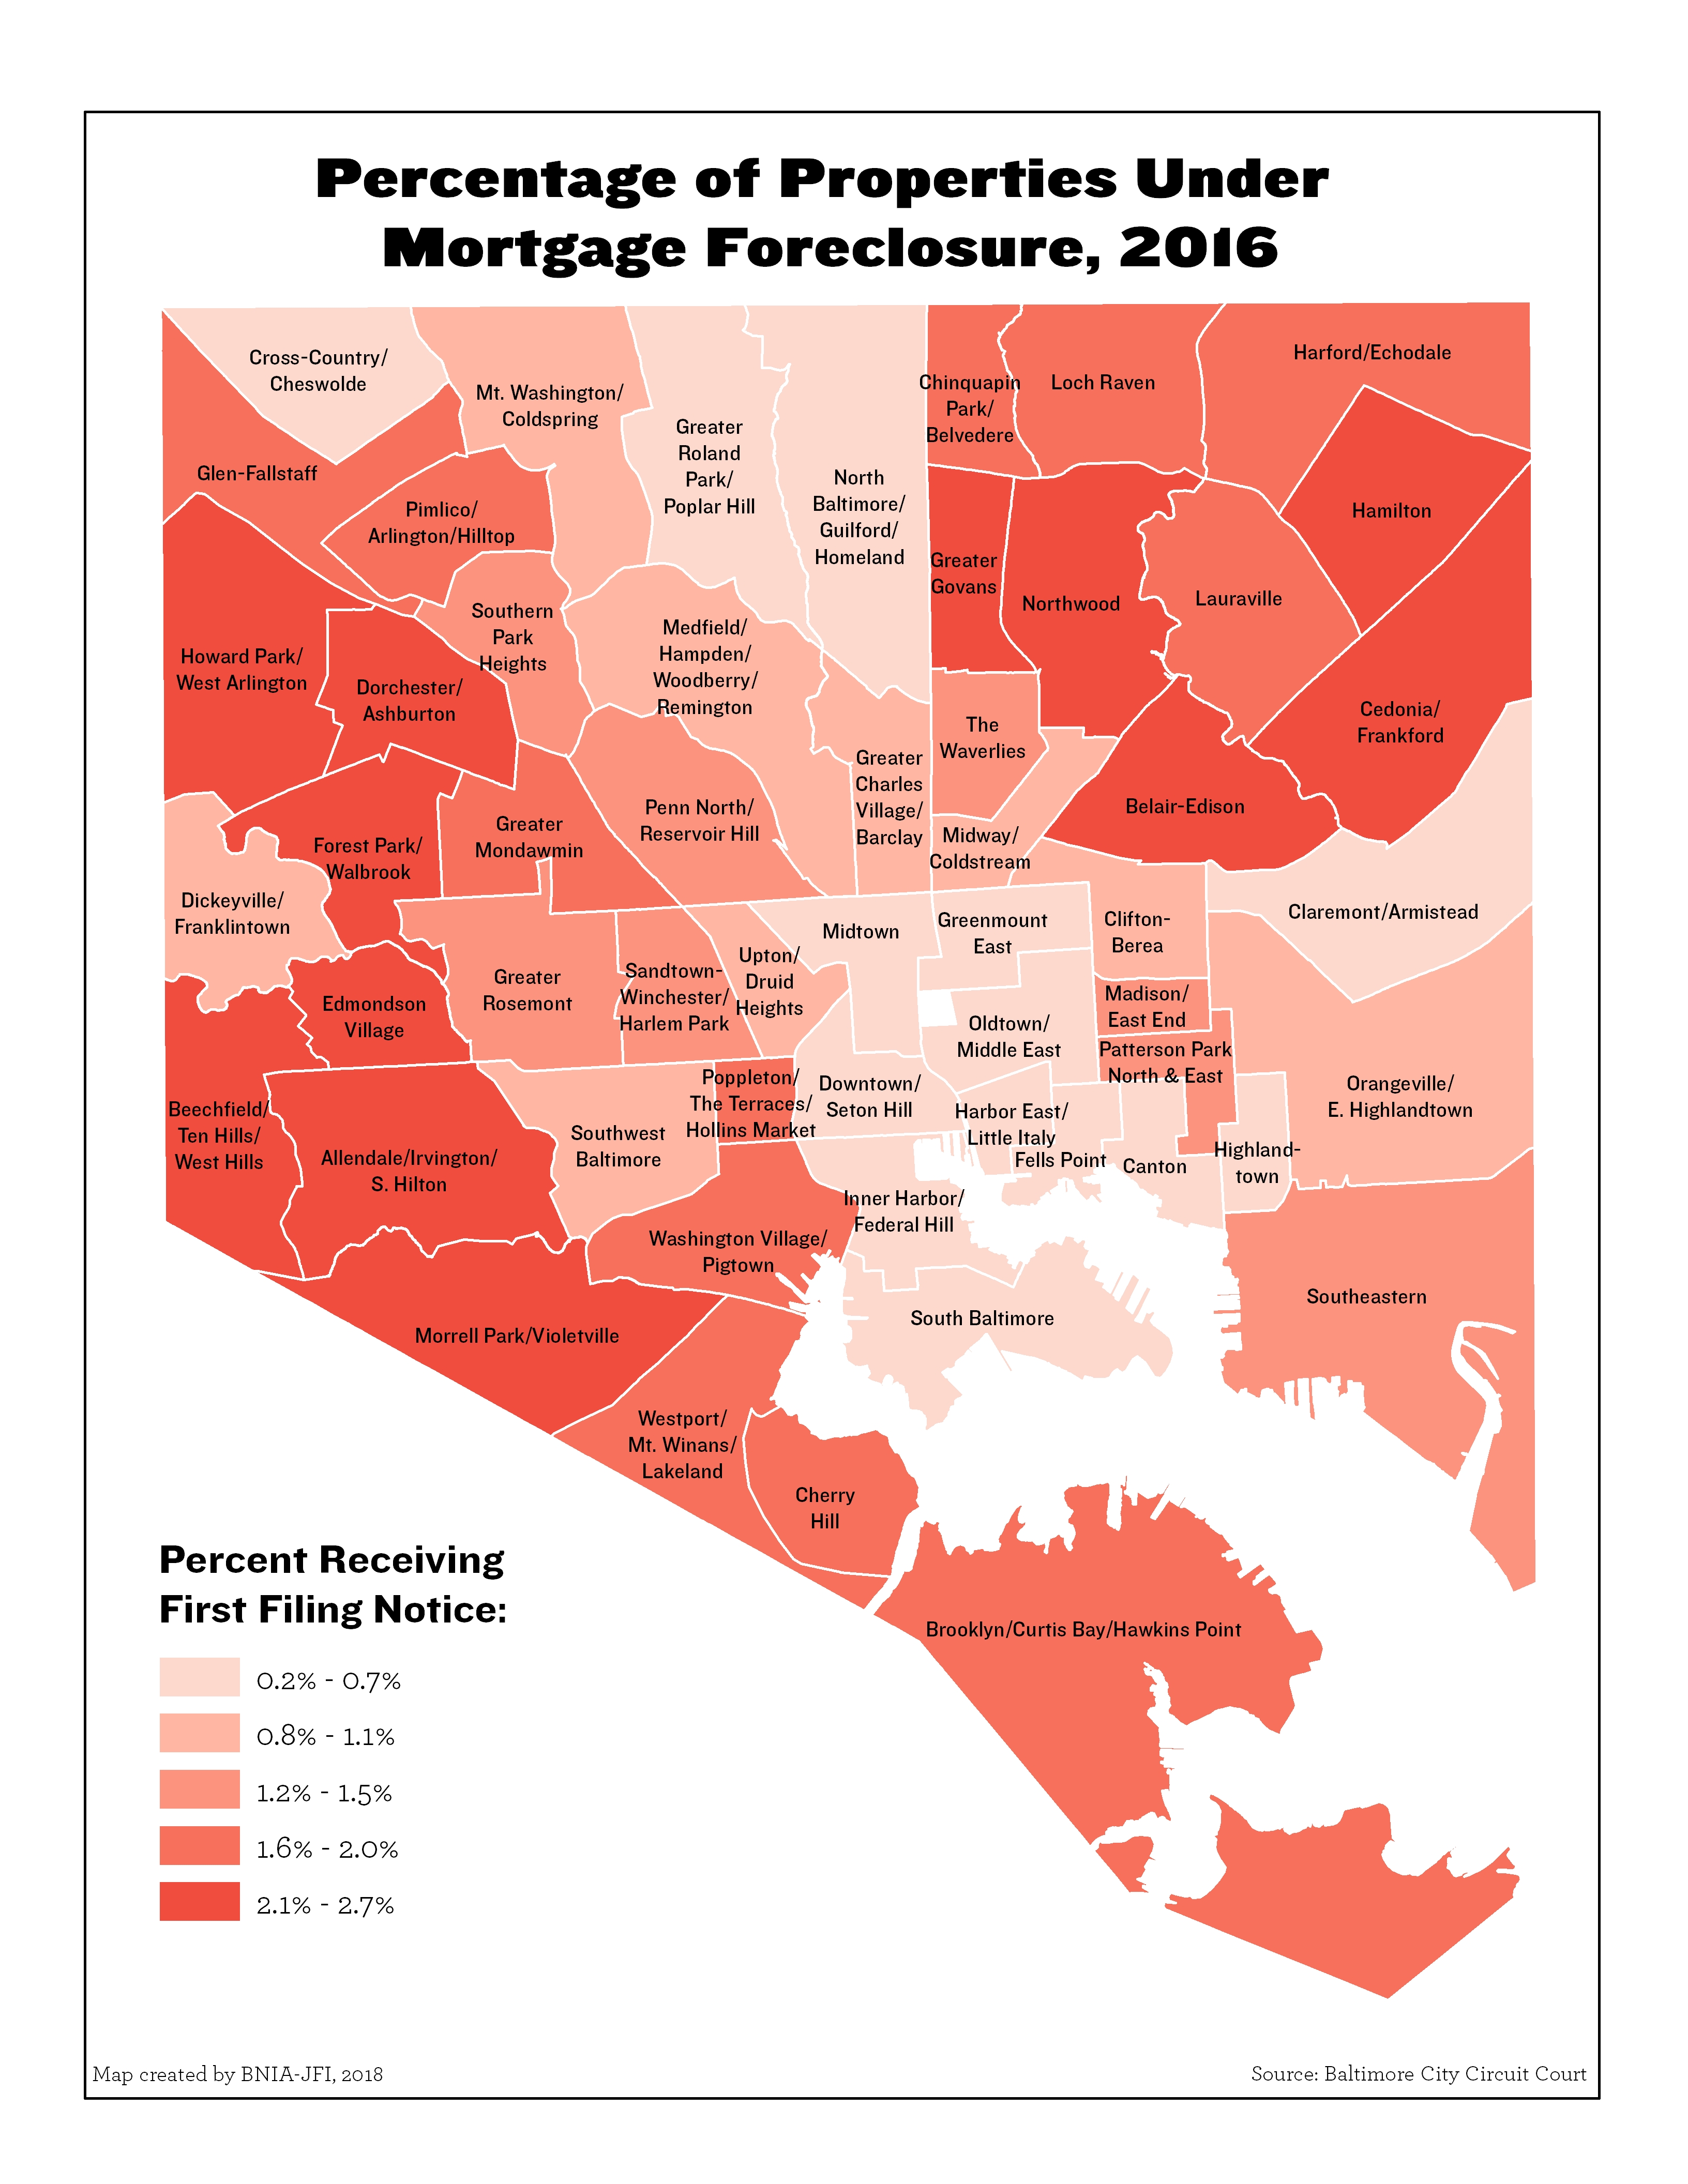
Percent of Properties Under Mortgage Foreclosure
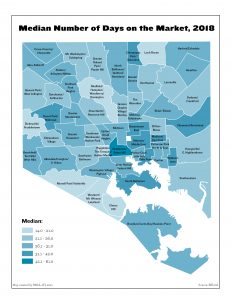
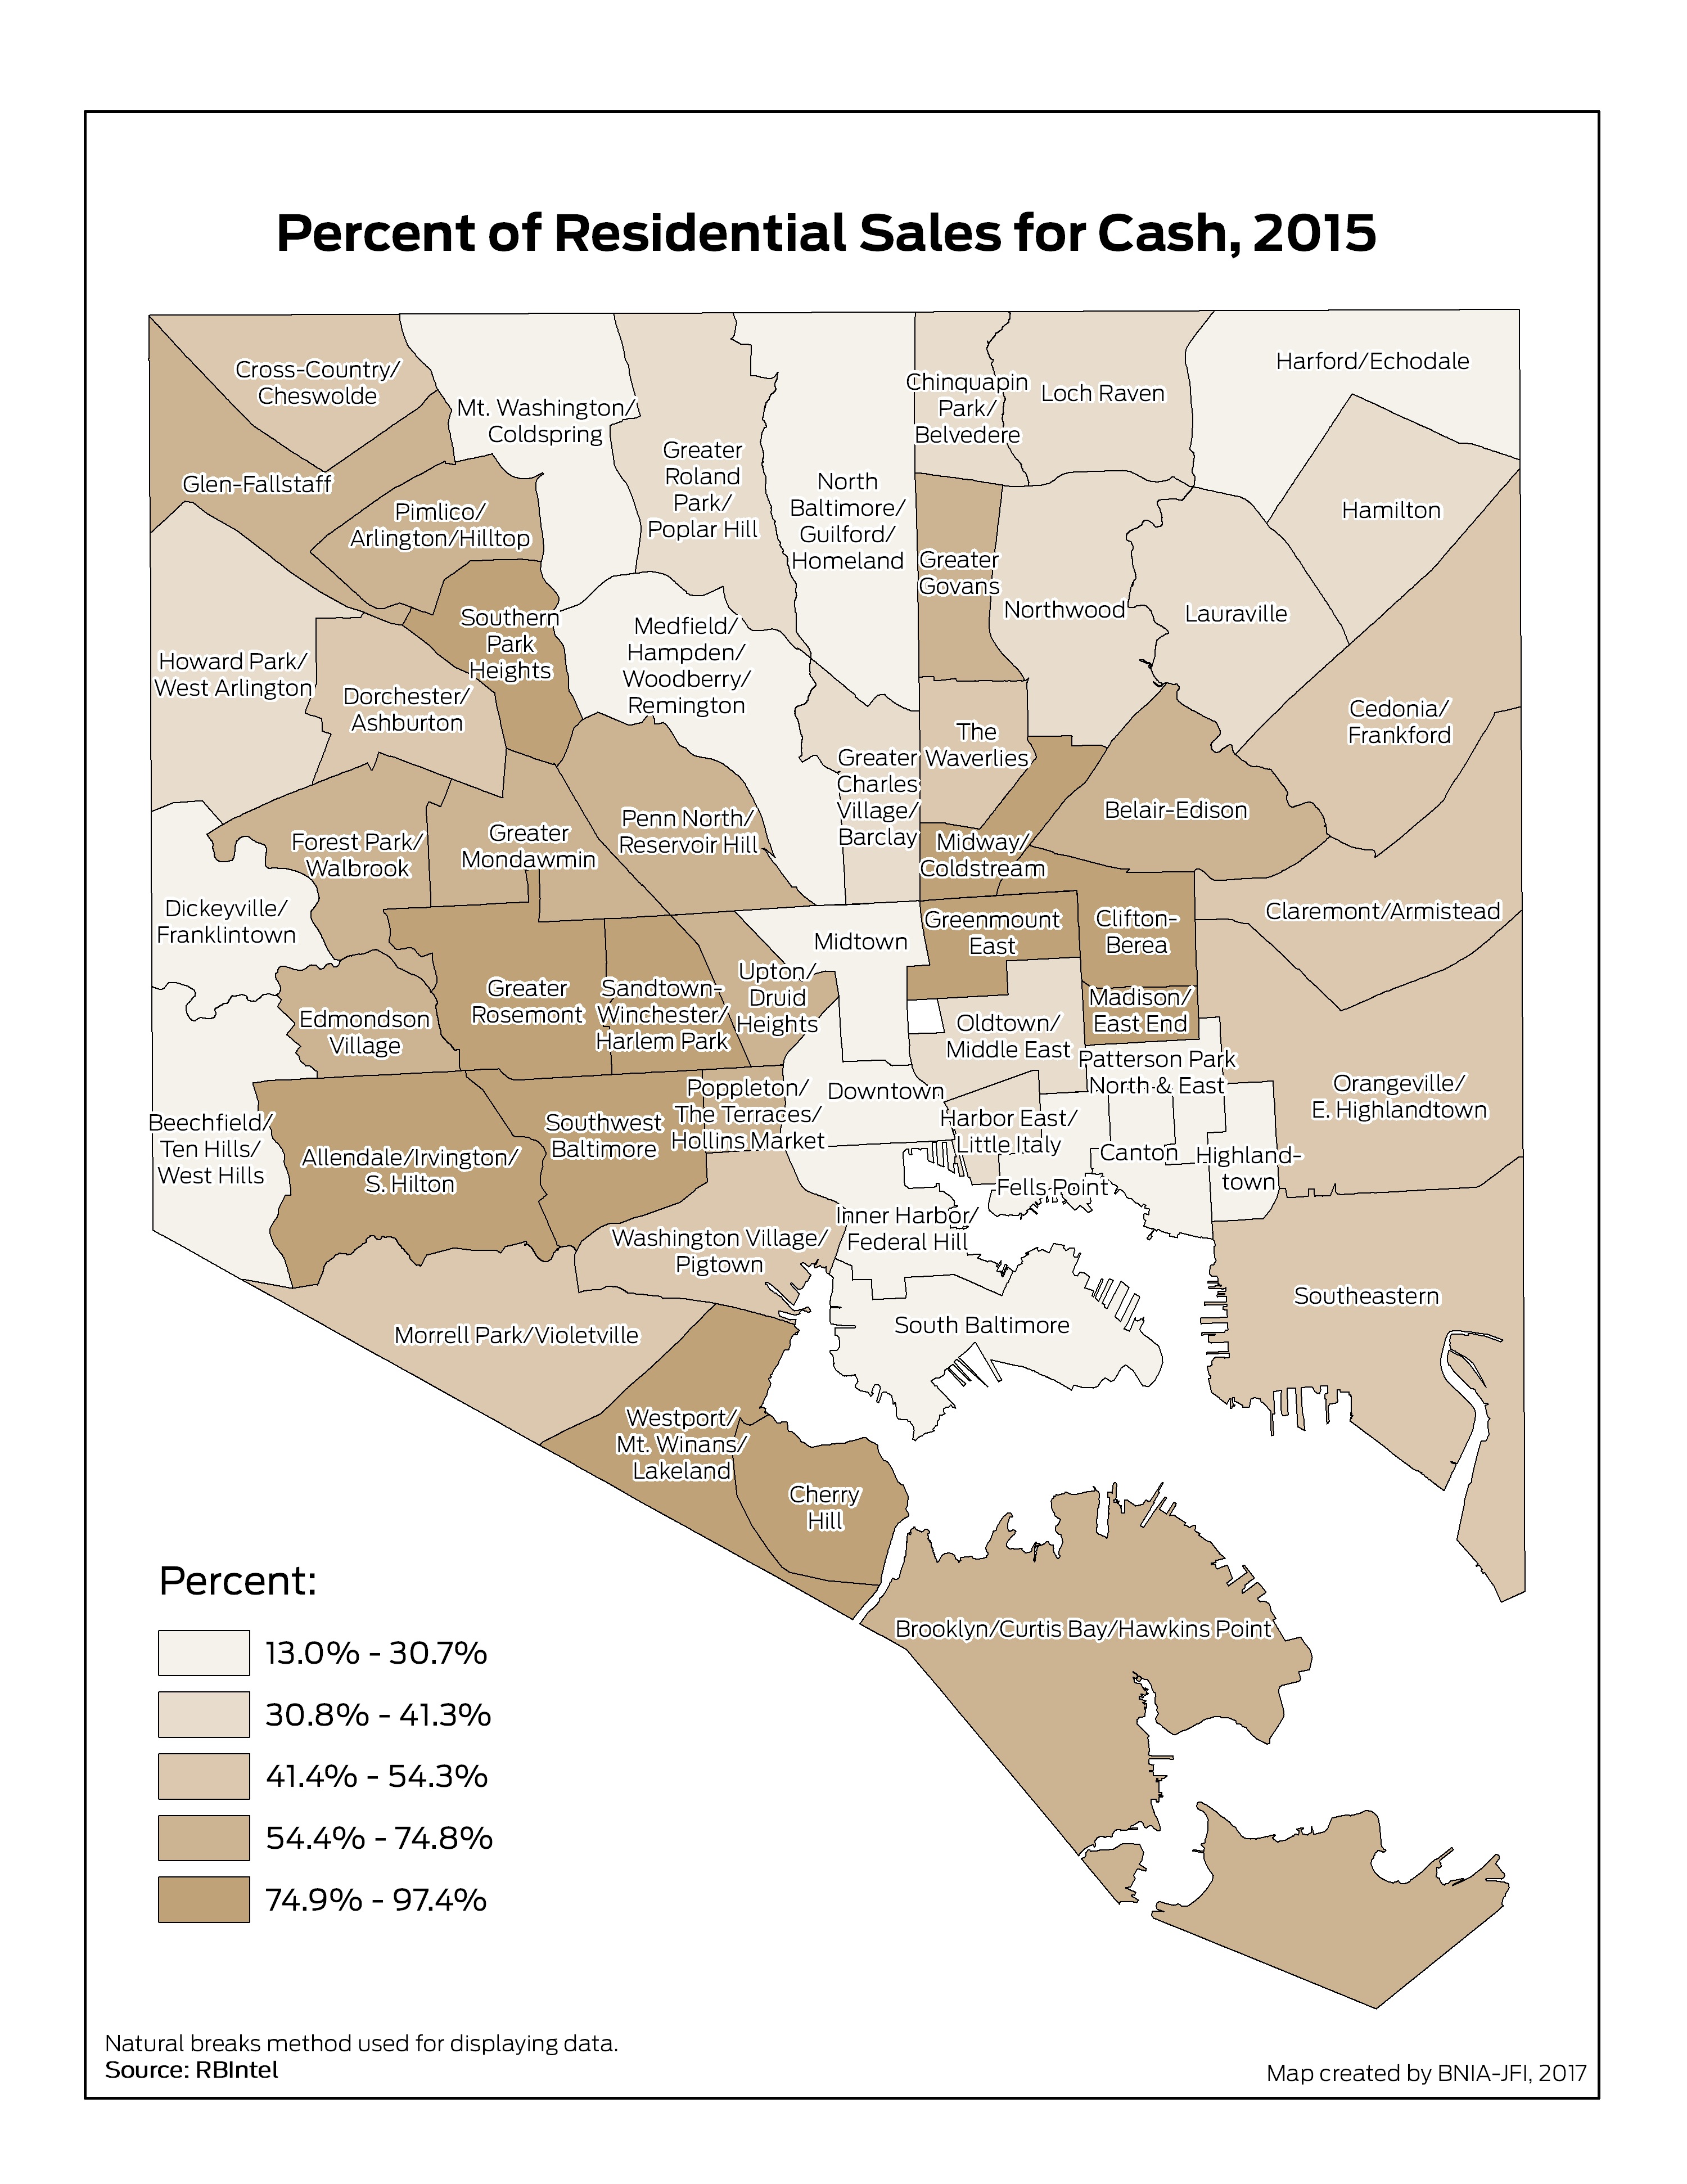
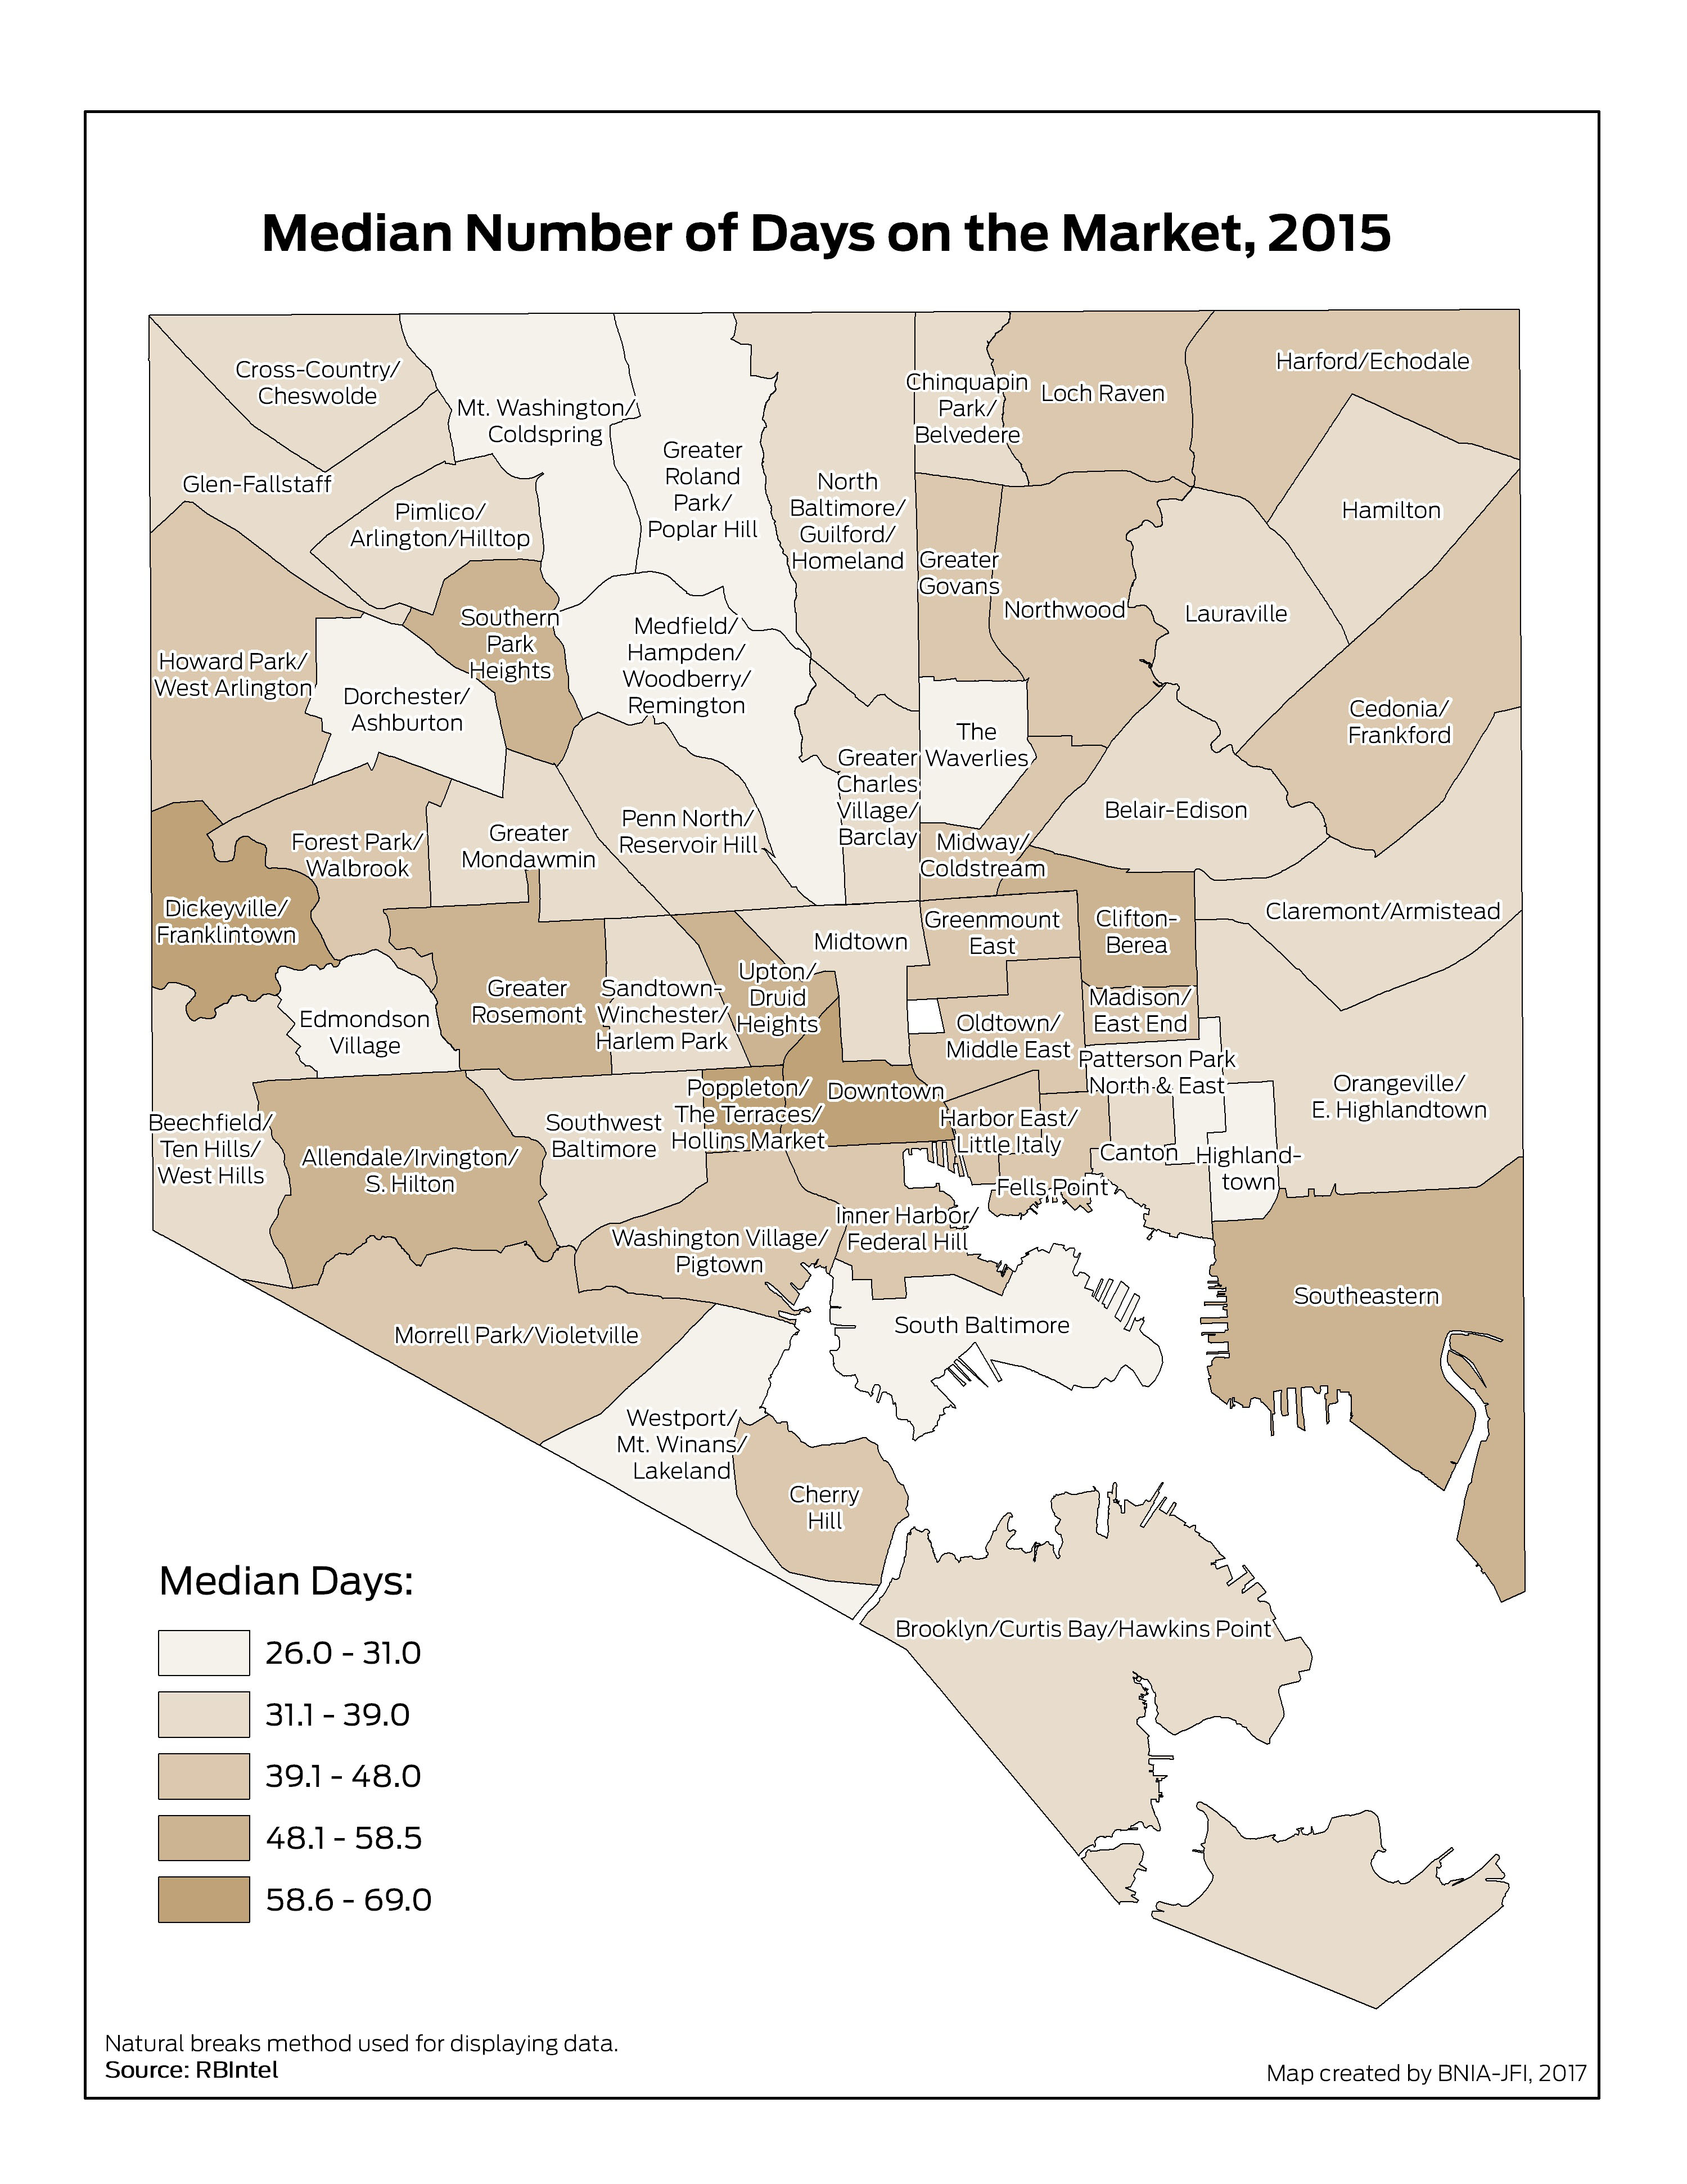
Median Number of Days on the Market
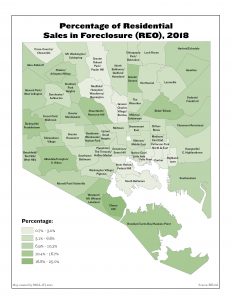
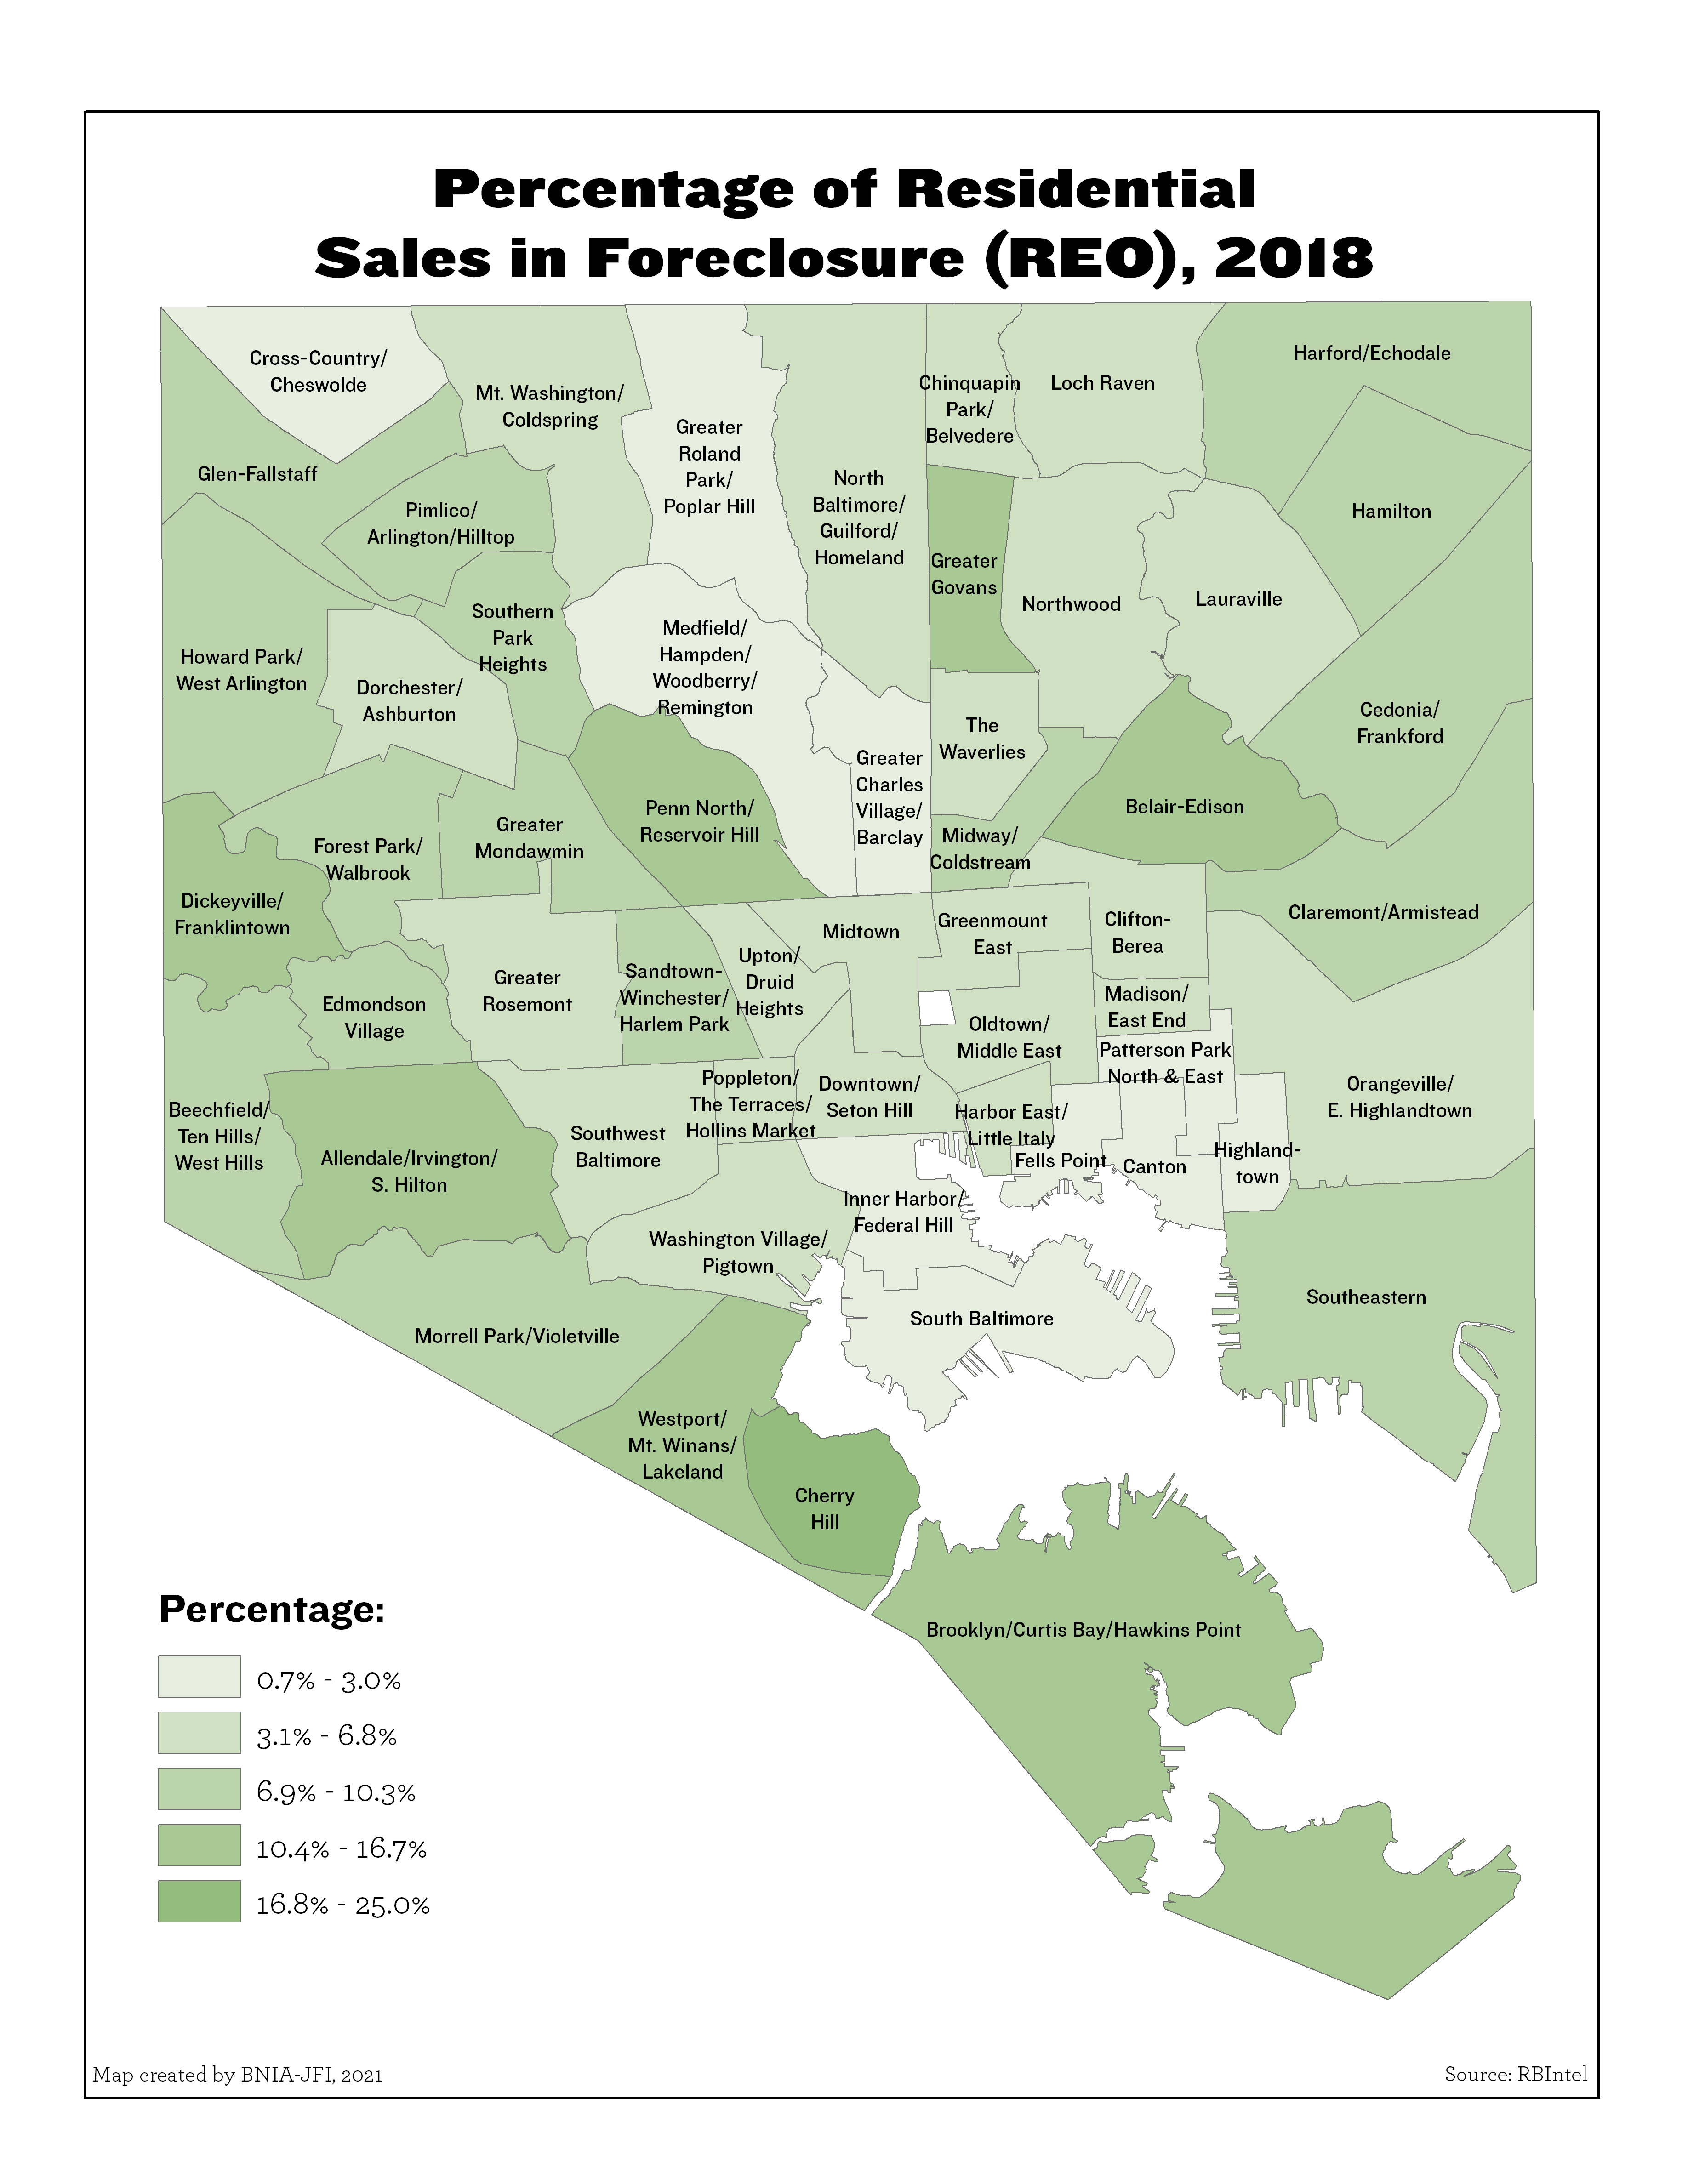
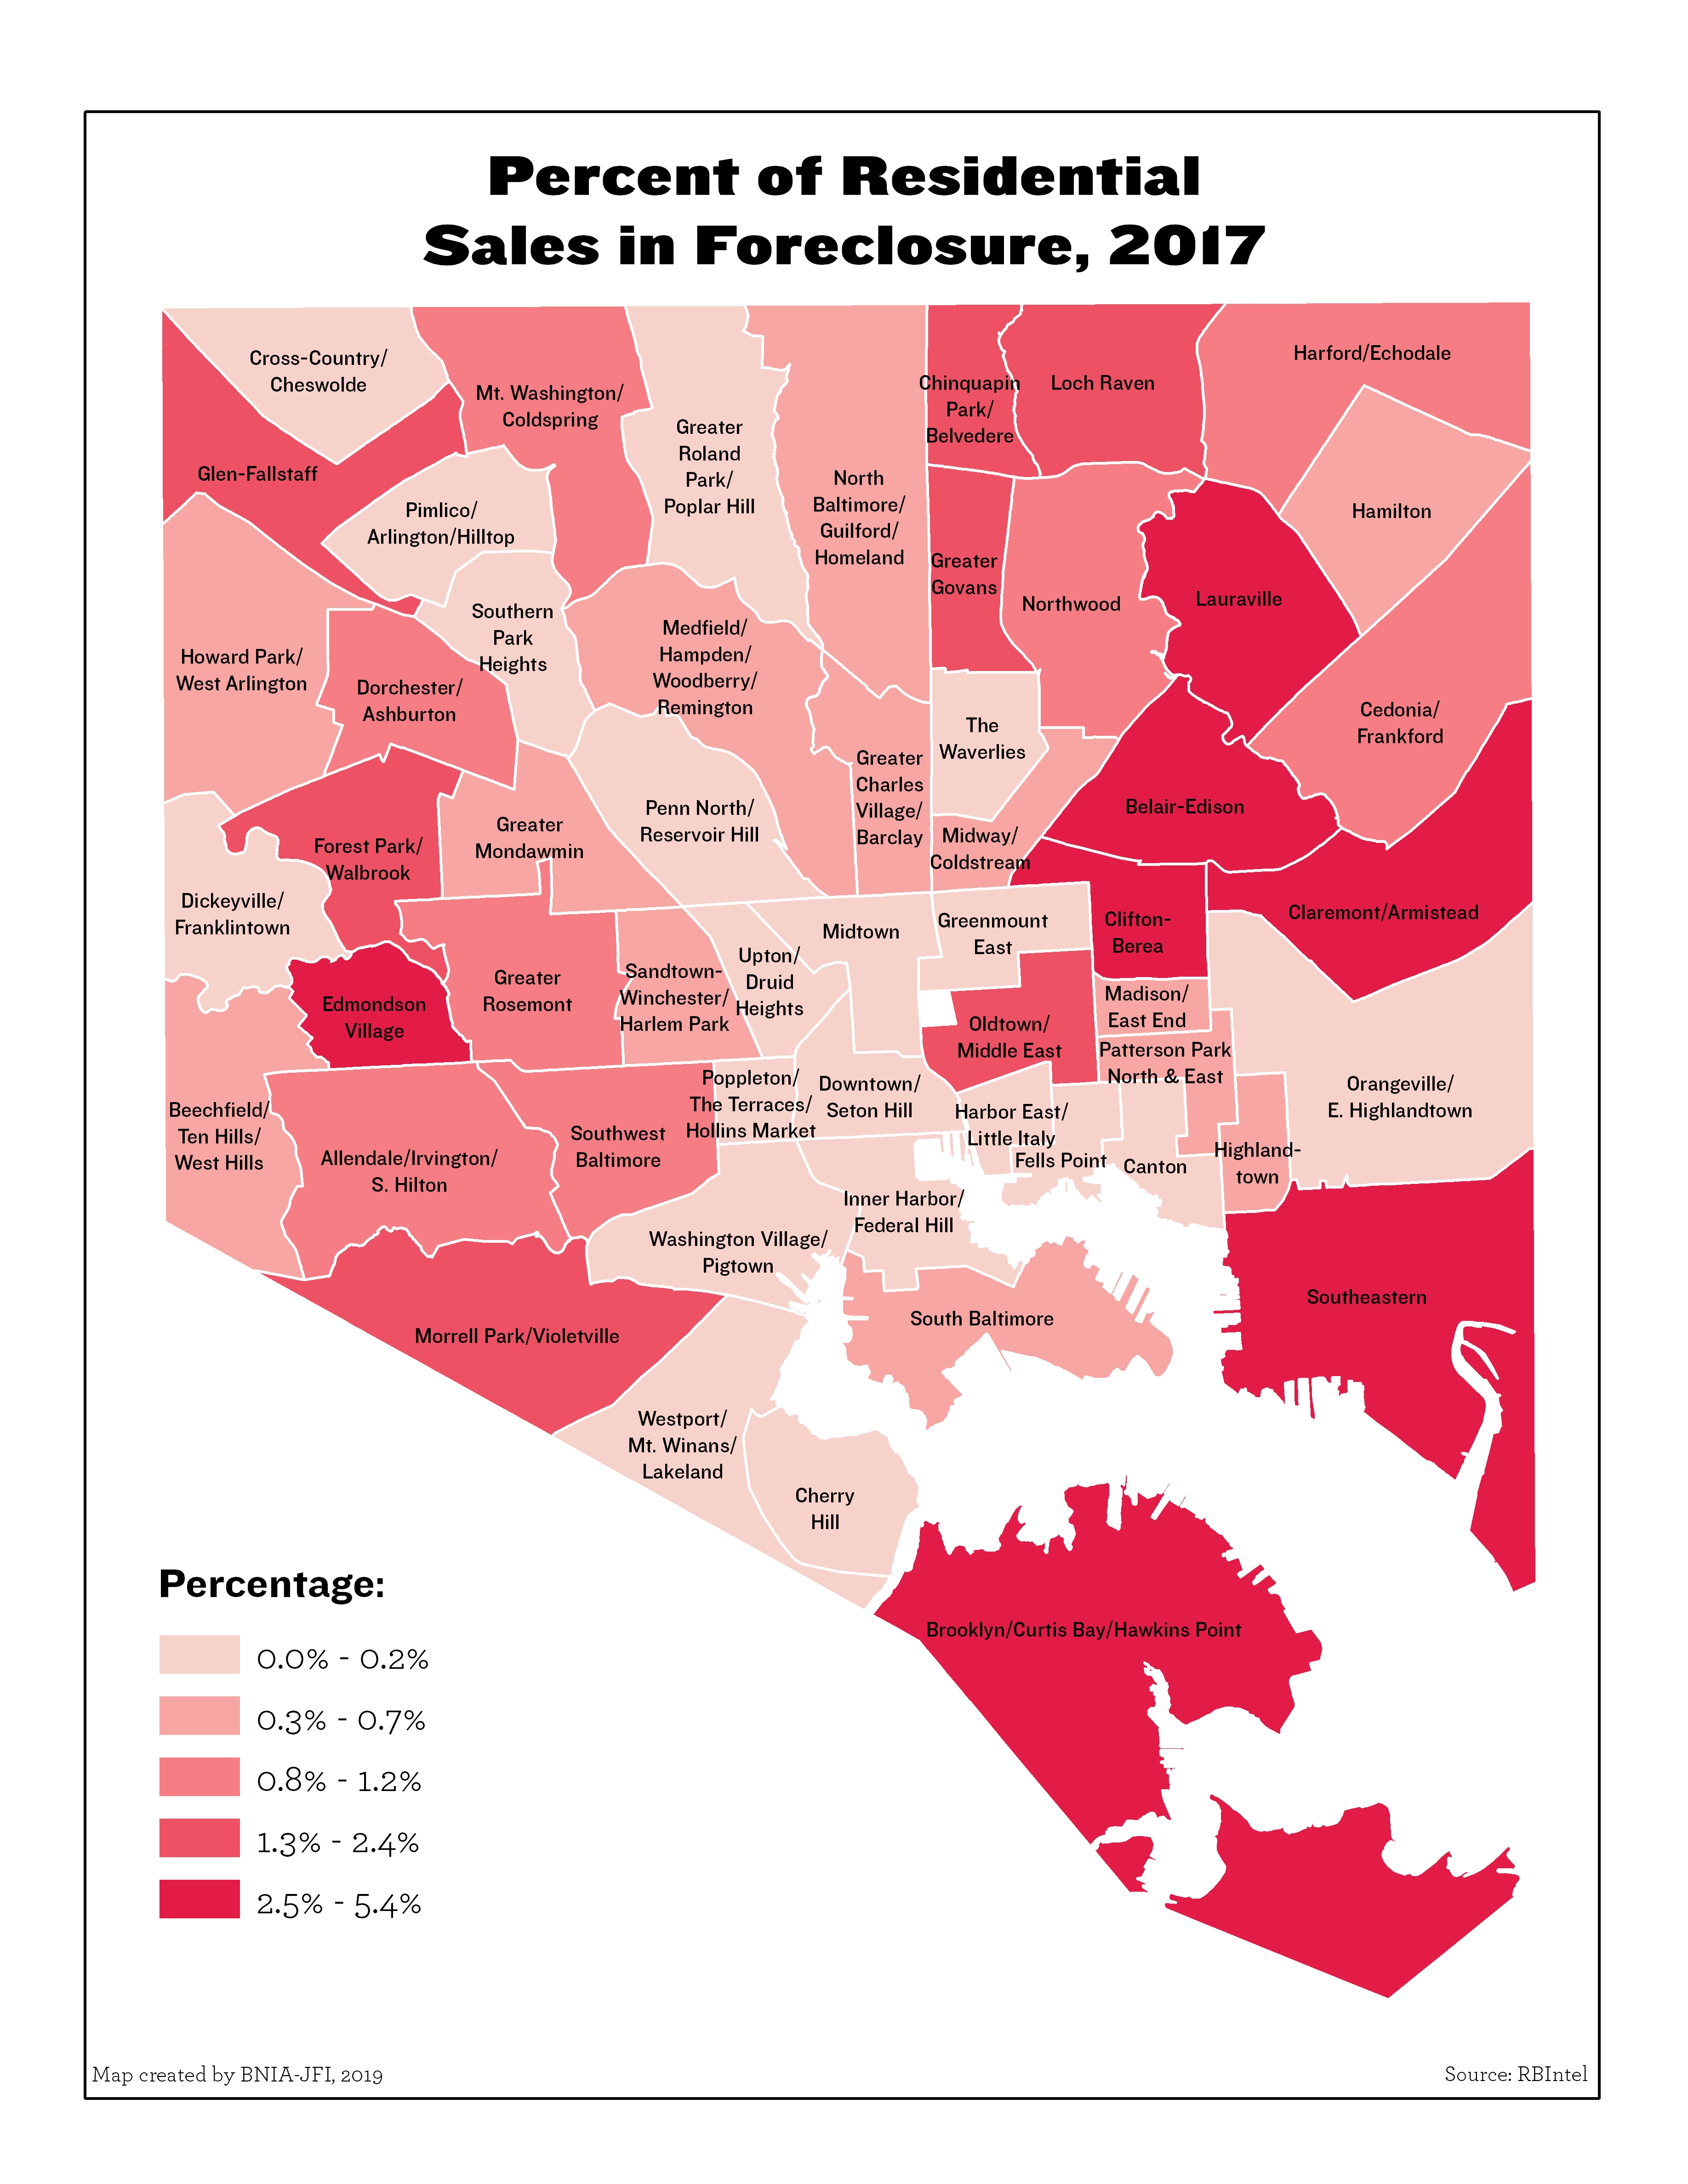
Percentage of Residential Sales in Foreclosure (REO)